• Request Info
  • Visit
  • Apply
  • Give
  • Request Info
  • Visit
  • Apply
  • Give

Search

  • A-Z Index
  • Map

Educational Leadership and Policy Studies

  • About
  • Our People
    • Our People Overview
    • Faculty
    • Staff
    • Students
  • Academic Programs
    • Academic Programs Overview
    • Adult & Continuing Education
    • College Student Personnel
    • Educational Administration
    • Evaluation Programs
    • Higher Education Administration
    • Undergraduate Studies
  • Education Research & Opportunity Center
  • Admissions & Information
    • Admissions Overview
    • Graduate Forms, Handbooks, and Resources
    • Contact ELPS
Home » Evaluation Methodology Blog

Serving with Purpose: Lessons Learned from Consulting in Assessment and Research

Serving with Purpose: Lessons Learned from Consulting in Assessment and Research

Serving with Purpose: Lessons Learned from Consulting in Assessment and Research

July 15, 2025 by Jonah Hall

Serving with Purpose: Lessons Learned from Consulting in Assessment and Research

By Jerri Berry Danso


​​​I’m Jerri Berry Danso, a first-year doctoral student in the Evaluation, Statistics, and Methodology (ESM) program at the University of Tennessee, Knoxville. Before beginning this new chapter, I spent over a decade working in higher education assessment: first as the Director of Assessment for the College of Pharmacy at the University of Florida, and later in Student Affairs Assessment and Research. During those years I learned how purposeful data work can illuminate student learning, sharpen strategic planning, and strengthen institutional effectiveness. Across these roles, I collaborated with faculty, staff, and administrators on a wide range of projects, where I supported outcomes assessment, research design, program evaluation, and data ​​storytelling.

Whether it was designing a survey for a student services office or facilitating a department’s learning outcomes retreat, I found myself consistently in the role of consultant: a partner and guide, helping others make sense of data and translate it into action. Consulting, I’ve learned, is not just about expertise; it also requires curiosity, humility, and a service mindset. And like all forms of service, it is most impactful when done with ​​purpose. My goal in this post is to share the values and lessons that shape my approach so you can adapt them to your own practice. 

What Does It Mean to Consult? 

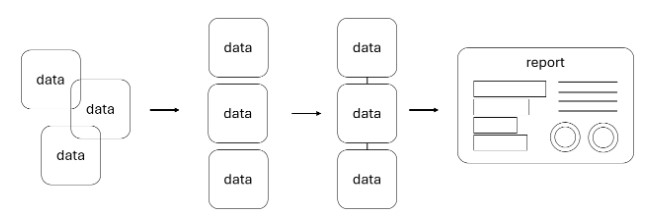
In our field, we often engage in informal consulting more than we realize. Consulting, at its core, is the act of offering expertise and guidance to help others solve problems or make informed decisions. In the context of ​​research, evaluation, assessment, and methodology, this can involve interpreting data, advising on survey design, facilitating program evaluation,​​ or co-creating strategies for data-informed improvement. 

I define consulting not only by what we do, but also by how we do it – through relationships built on trust, clarity, and mutual respect. If you’ve ever had someone turn to you for guidance on a research or assessment issue because of your experience, congratulations! You’ve already engaged in consulting. 

My Core ​​Consulting Values 

My foundation as a consultant is rooted in an early lesson from graduate school. While earning my first master’s degree in Student Personnel in Higher Education, I took a counseling skills course that fundamentally shaped how I interact with others. We were taught a core set of helping behaviors: active listening, empathy, reflection, open-ended questioning, and attention to nonverbal cues. Though designed for future student affairs professionals, these skills have served me equally well in consulting settings. 

From that experience, and years of practice, my personal consulting values have emerged: 

  • Empathy: Understanding what matters to the client, listening deeply, and genuinely caring about their goals. 
  • Integrity: Being transparent, honest, and grounded in ethical principles, especially when working with data. 
  • Collaboration: Co-creating solutions with clients and recognizing that we are partners, not saviors. 
  • Responsibility: Taking ownership of work, meeting commitments, and communicating clearly when plans change. 
  • Excellence: Striving for quality in both process and product, whether that product is a report, a workshop, or a relationship.

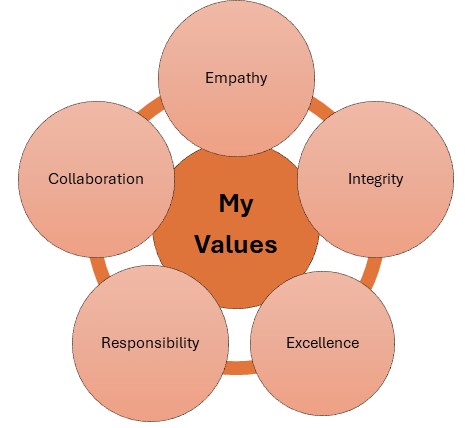
These values are my compass. They help me navigate difficult decisions, maintain consistency, and most importantly, deliver service that is thoughtful and human-centered. 

Lessons from the​​ Field 

​​​Over the years, I’ve learned that the best consultants don’t just deliver technical expertise. They cultivate trust. Here are a few key lessons that have stuck with me: 

  1. Follow through on your promises. If you say you’ll deliver something by a certain date, do it, or communicate early if something changes. Reliability builds ​​credibility and fosters trust in professional relationships. 
  1. Set expectations early. Clarify what you will provide and what you need from your client to be successful. Unmet expectations often stem from assumptions left unspoken. 
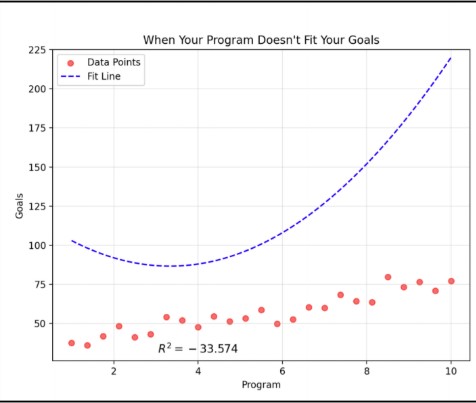
  1. Stick to your values. Never compromise your integrity. For example, a client asked me to “spin” data to present their program in a more favorable light. I gently reminded them that our role was to find truth, not polish it, and that honest data helps us improve. 
  1. Anticipate needs. When appropriate, go a step beyond the request. In one project, I created a detailed methodology plan for a project that the client hadn’t asked for. They later told me it became a key reference tool throughout the project. 
  1. Adapt your communication. Know your audience. Avoid overwhelming clients with technical jargon, but don’t oversimplify in a way that’s condescending. Ask questions, check for understanding, and create space for curiosity without judgment. 

​​​The Art of Service 

Good consulting is about more than solving problems; it is equally about how you show up for others. What I’ve come to call the art of service is an intentional approach to client relationships grounded in care, curiosity, and a commitment to helping others thrive. This includes:

  • Practicing empathy and active listening  
  • Personalizing communication and building rapport 
  • Going beyond what’s expected when it adds value 
  • Continuously reflecting on your approach and improving your craft 

These principles align closely with literature on counseling and helping relationships. For instance, Carl Rogers (1951) emphasized the power of empathy, congruence, and unconditional positive regard. These are qualities that, when applied in consulting, build trust and facilitate honest conversations. Gerald Egan (2014), in The Skilled Helper, also highlights how intentional listening and support lead to more effective outcomes. 

A Call to Aspiring Consultants 

You don’t need consultant in your job title to serve others through your expertise. ​​Whether you’re a graduate student, an analyst, or a faculty member, you can bring consulting values into your work, especially in the measurement, assessment, evaluation, and statistics fields, where collaboration and service are central to our mission. 

So, here’s my invitati​​on to you:  

Take some time to define your own values. Reflect on how you show up in service to others. Practice listening more deeply, communicating more clearly, and delivering with care. The technical side of our work is vital, but the human side? That’s where transformation happens. 

​​​Resources for Further Re​​ading 

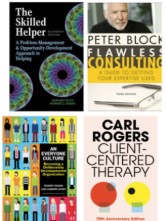
  • Egan, G. (2014). The Skilled Helper: A Problem-Management and Opportunity-Development Approach to Helping (10th ed.). Cengage Learning. 
  • Rogers, C. R. (1951). Client-Centered Therapy: Its Current Practice, Implications and Theory. Houghton Mifflin. 
  • Block, P. (2011). Flawless Consulting: A Guide to Getting Your Expertise Used (3rd ed.). Wiley. 
  • Kegan, R., & Lahey, L. L. (2016). An Everyone Culture: Becoming a Deliberately Developmental Organization. Harvard Business Review Press. 

Filed Under: Evaluation Methodology Blog

Navigating Ambiguity and Asymmetry: from Undergraduate to Graduate Student and Beyond

Navigating Ambiguity and Asymmetry: from Undergraduate to Graduate Student and Beyond

June 15, 2025 by Jonah Hall

Navigating Ambiguity and Asymmetry: from Undergraduate to Graduate Student and Beyond

By Jessica Osborne, Ph.D. and Chelsea Jacobs

Jessica is the Principal Evaluation Associate for the Higher Education Portfolio at The Center for Research Evaluation at the University of Mississippi. She earned a PhD in Evaluation, Statistics, and Measurement from the University of Tennessee, Knoxville, an MFA in Creative Writing from the University of North Carolina, Greensboro, and a BA in English from Elon University. Her main areas of research and evaluation are undergraduate and graduate student success, higher education systems, needs assessments, and intrinsic motivation. She lives in Knoxville, TN with her husband, two kids, and three (yes, three…) cats. 

My name is Chelsea Jacobs, and I’m a PhD student in the Evaluation, Statistics, and Methodology (ESM) program at the University of Tennessee, Knoxville. I’m especially interested in how data and evidence are used to inform and improve learning environments. In this post, I’ll share reflections — drawn from personal experience and professional mentorship — on navigating the ambiguity and asymmetry that often define the transition from undergraduate to graduate education. I’ll also offer a few practical tips and resources for those considering or beginning this journey. 

Transitioning from undergraduate studies to graduate school is an exciting milestone, full of possibilities and challenges. For many students, it also marks a shift in how success is measured and achieved. We — Jessica Osborne, PhD, Principal Evaluation Associate at The Center for Research Evaluation at the University of Mississippi, and Chelsea Jacobs, PhD student at the University of Tennessee — have explored these topics during our professional networking and mentoring sessions. While ambiguity and asymmetry may exist in undergraduate education, they often become more pronounced and impactful in graduate school and professional life. This post sheds light on these challenges, offers practical advice, and points prospective graduate students to resources that can ease the transition. 

From Clarity to Exploration: Embracing Ambiguity in Graduate Education 

In undergraduate studies, assessments often come in the form of multiple-choice questions or structured assignments, where answers are concrete and feedback is relatively clear-cut. From a Bloom’s Taxonomy perspective, this often reflects the “remembering” domain. Success may align with effort — study hard, complete assignments, and you’ll likely earn good grades. 

Graduate school, however, introduces a level of ambiguity that can be unexpectedly challenging. Research projects, thesis writing, and professional collaborations often lack clear guidelines or definitive answers. Feedback becomes more subjective, reflecting the complexity and nuance of the work. For example, a research proposal may receive conflicting critiques from reviewers, requiring students to navigate gray areas with the support of advisors, peers, and faculty. 

These shifts are compounded by a structural difference: while undergraduates typically have access to dedicated offices and resources designed to support their success, graduate students often face these challenges with far fewer institutional supports. This makes it all the more important to cultivate self-advocacy, build informal support networks, and learn to tolerate uncertainty. 

Though ambiguity can feel overwhelming, it’s also an opportunity to develop critical thinking and problem-solving skills. Graduate school encourages asking deeper questions, exploring multiple perspectives, and embracing the process of learning rather than focusing solely on outcomes. 

How to Navigate Ambiguity 

Embrace the Learning Curve: Ambiguity is not a sign of failure but a necessary condition for growth—it pushes us beyond routine practice and encourages deeper, more flexible thinking. Seek opportunities to engage with complex problems, even if they feel overwhelming at first, as these moments often prompt the most meaningful development. 

Ask for Guidance: Don’t hesitate to seek clarification from advisors, peers, or those just a step ahead in their academic journey. Opening up about your struggles can reveal how common they are — and hearing how others have navigated doubt or setbacks can help you build the resilience to keep moving forward. Graduate school can be a collaborative space, and connection can be just as important as instruction. 

In the ESM program at UTK, we’re fortunate to be part of a collaborative, non-competitive graduate environment. This isn’t the case for all graduate programs, so it’s an important factor to consider when choosing where to study. 

Uneven Roads: Embracing the Asymmetry of Growth 

As an undergraduate, effort is often emphasized as the key to success, but the relationship between effort and outcome isn’t always straightforward. Study strategies, access to resources, prior preparation, and support systems all play a role — meaning that even significant effort doesn’t always lead to the expected results. However, success can align with effort—study hard, complete assignments, and you’ll likely earn good grades. 

In graduate school and professional life, this symmetry can break down. You might invest months into a research paper, only to have it rejected by a journal. Grant proposals, job applications, and conference submissions often yield similar results—hard work doesn’t always guarantee success, but it does guarantee learning. 

This asymmetry can be disheartening, but it mirrors the realities of many professional fields. Learning to navigate it is crucial for building resilience and maintaining motivation. Rejection and setbacks are not personal failures but part of growth. 

How to Handle Asymmetry 

Redefine Success: Focus on the process rather than the outcome. Every rejection is an opportunity to refine your skills and approach. 

Build Resilience: Mistakes, failures, and rejection are not just normal—they’re powerful learning moments. These experiences often reveal knowledge or skill gaps more clearly than success, making them both memorable and transformative. Cultivating a growth mindset helps reframe setbacks as essential steps in your development. 

Seek Support: Surround yourself with a network of peers, mentors, and advisors who can offer perspective and encouragement. 

Resources for Prospective Graduate Students 

Workshops and seminars can help students build essential skills — offering guidance on research methodologies, academic writing, and mental resilience. 

Here are a few resources to consider: 

  • Books: Writing Your Journal Article in Twelve Weeks by Wendy Laura Belcher is excellent for developing academic writing. The Writing Workshop, recommended by a University of Michigan colleague, is a free, open-access resource. 
  • Research Colloquium: UTK students apply research skills in a colloquium setting. See Michigan State University’s Graduate Research Colloquium for a similar example. These events are common — look into what your institution offers. 
  • Campus Resources: Don’t overlook writing centers, counseling centers, and mental health services. For example, Harvard’s Counseling and Mental Health Services provides a strong model. Explore what’s available at your school. 
  • Professional Networks: Join organizations or online communities in your field. This can lead to mentorship, which is invaluable — and worthy of its own blog post. 

Final Thoughts 

Ambiguity and asymmetry are not obstacles to be feared but challenges to be embraced. They help develop the critical thinking, problem-solving, and resilience needed for both graduate school and a fulfilling professional career. By understanding these aspects and using the right resources, you can navigate the transition with confidence. 

To prospective graduate students: welcome to a journey of growth, discovery, and MADness — Meaningful, Action-Driven exploration of methods and measures. We’re excited to see how you’ll rise to the challenge. 

Filed Under: Evaluation Methodology Blog

My Journey In Writing A Bibliometric Analysis Paper

My Journey In Writing A Bibliometric Analysis Paper

June 1, 2025 by Jonah Hall

My Journey In Writing A Bibliometric Analysis Paper

As a third-year doctoral student in Evaluation, Statistics, and Methodology at the University of Tennessee, Knoxville, I recently completed a bibliometric analysis paper for my capstone project on Data Visualization and Communication in Evaluation. Bibliometrics offers a powerful way to quantify research trends, map scholarly networks, and identify gaps in literature. It is an invaluable research method for evaluators and researchers alike. Hello everyone! I am Richard D. Amoako. 

Learning bibliometrics isn’t always straightforward. Between choosing the right database, wrangling APIs, and figuring out which R or Python packages won’t crash your laptop, there’s a steep learning curve. That’s why I’m writing this: to share the lessons, tools, and occasional frustrations I’ve picked up along the way. Whether you’re an evaluator looking to map trends in your field or a researcher venturing into bibliometrics for the first time, I hope this post saves you time, sanity, and a few coding headaches. Let’s explore the methodology, applications, and resources that shaped my project. 

Understanding Bibliometric Analysis 

Bibliometric analysis is the systematic study of academic publications through quantitative methods- examining citations, authorship patterns, and keyword frequencies to reveal research trends. Bibliometric analysis differs from traditional literature reviews by delivering data-driven insights into knowledge evolution within a field. Common applications include identifying influential papers, mapping collaboration networks, and assessing journal impact (Donthu, et al., 2021; Van Raan, et a., 2018; Zupic & Čater, 2015). 

For evaluators, this approach is particularly valuable. It helps track the adoption of evaluation frameworks, measure scholarly influence, and detect emerging themes, such as how data visualization has gained traction in recent years. My interest in bibliometrics began while reviewing literature for my capstone project. Faced with hundreds of papers, I needed a way to objectively analyze trends rather than rely on subjective selection. Bibliometrics provide that structure, turning scattered research into actionable insights. 

Key Steps in Writing a Bibliometric Paper 

Defining Research Objectives 
The foundation of any successful bibliometric study lies in crafting a precise research question. For my capstone on data visualization in evaluation literature, I focused on: “How has the application of data visualization techniques evolved in program evaluation research from 2010-2025?” This specificity helped me avoid irrelevant data while maintaining analytical depth. Before finalizing my question, I reviewed existing systematic reviews to identify underexplored areas – a crucial step that prevented duplication of prior work. When brainstorming and refining your thoughts, utilize productive technologies such as generative AI tools (such as ChatGPT, Claude, Perplexity, Google Gemini, Microsoft Copilot, DeepSeek, etc.)  to enhance and clarify your ideas.   

Database Selection and Data Collection 
Choosing the right database significantly impacts study quality. After comparing options, I selected Scopus for its comprehensive coverage of social science literature and robust citation metrics. While Web of Science (WoS) offers stronger impact metrics, its limited coverage of evaluation journals made it less suitable. Nonetheless, I examined the potential applications of using WoS. Google Scholar’s expansive but uncurated collection proved too noisy for systematic analysis. Scopus’s ability to export 2,000 records at once and include meta-data such as author affiliation, country proved invaluable for my collaboration mapping. 

Data Extraction and Automation 
To efficiently handle large datasets, I leveraged R’s Bibliometrix package. Use this R script to automate your data extraction with the Scopus API (Application Programming Interface). APIs enable software systems to communicate with each other. Researchers can use APIs to automate access to database records (like Scopus, WoS) without manual downloading. To access the Scopus database, request access via Elsevier’s Developer Portal. 

Pros: Good for large-scale scraping. Cons: Requires API key approval (can take days or weeks).  

For targeted bibliometric searches, carefully construct your keyword strings using Boolean operators (AND/OR/NOT) and field tags like TITLE-ABS-KEY() to balance recall and precision – for example, my search TITLE-ABS-KEY(“data visualization” AND “evaluation”) retrieved 37% more relevant papers than a simple keyword search by excluding off-topic mentions in references. 

After exporting Scopus results to CSV, a simple script converted and analyzed the data (Aria & Cuccurullo, 2017): 

library(bibliometrix) 

M <- convert2df(“scopus.csv”, dbsource = “scopus”, format = “csv”) 

results <- biblioAnalysis(M) 

This approach provided immediate insights into citation patterns and author networks.  

Data Screening and Cleaning 
The initial search may return many papers; my search returned over 2,000. To narrow down the most relevant articles, you can apply filters such as: 

  1. Removing duplicates via DOI matching [use R code, M <- M[!duplicated(M$DO), ] #Remove by DOI. Duplicates are common in multidatabase studies.  
  1. Excluding non-journal articles 
  1. Excluding irrelevant articles that do not match your research questions or inclusion criteria 
  1. Manual review of random samples to verify relevance 

Additional data cleaning may be required. I use R’s tidyverse, janitor or dplyr packages for these tasks.  

The screening process can be overwhelming and time-consuming if performed manually. Fortunately, several tools and websites are available to assist with this task. Notable examples include abstrackr, convidence.org, rayyan.ai, AsReview, Loonlens.com, and nested-knowledge. These tools require well-defined inclusion and exclusion criteria. It is essential to have thoroughly considered criteria in place. Among these tools, my preferred choice is Loonlens.com, which automates the screening process based on the specified criteria and generates a CSV file with decisions and reasons upon completion. 

Analysis and Visualization  

Key analytical approaches included (refer to the appendices for R codes and this guideline): 

  • Citation analysis to identify influential works 
  • Co-authorship network mapping to reveal collaboration patterns 
  • Keyword co-occurrence analysis to track conceptual evolution 
  • Country and institution analysis to identify geographical collaborations and impacts 

For visualization, VOSviewer creates clear keyword co-occurrence maps, while CiteSpace helps identify temporal trends. The bibliometrix package streamlined these analyses, with functions like conceptualStructure() revealing important thematic connections. Visualization adjustments (like setting minimum node frequencies) transformed initial “hairball” network diagrams into clear, interpretable maps.  

This structured approach, from precise question formulation through iterative visualization – transformed a potentially overwhelming project into manageable stages. The automation and filtering strategies proved particularly valuable, saving countless hours of manual processing while ensuring analytical rigor.  

All the R code I used for data cleaning, analysis, and visualization is available on my GitHub repository. 

Challenges & How to Overcome Them 

Bibliometric analysis comes with its fair share of hurdles. Early in my project, I hit a major roadblock when I discovered many key papers were behind paywalls. My solution? I leveraged my university’s interlibrary loan/resource sharing system and reached out directly to authors via ResearchGate to request for full text – some responded with their papers. API limits were another frustration, particularly with Scopus’s weekly request cap (20,000 publications per week). I used R’s httr package to space out requests systematically, grouping queries by year or keyword to stay under Scopus’s weekly limit while automating the process. In addition to utilizing the API, you may access Scopus with your institutional credentials to manually search for papers using your key terms. You can then export your results in various formats such as CSV, RIS, and BibTex. 

The learning curve for R’s Bibliometrix package nearly derailed me in week two. After spending hours on error messages, I discovered the package’s excellent documentation and worked through their tutorial examples line by line. This hands-on approach helped me master essential functions within a week. 

Perhaps the trickiest challenge was avoiding overinterpretation. My initial excitement at seeing strong keyword clusters nearly led me to make unsupported claims. Consult with your advisor, a colleague or expertise in your field to help you distinguish between meaningful patterns and statistical noise. For instance, I found that a seemingly important keyword connection was just due to some prolific author’s preferred terminology. 

For clarity in my visualization, I use a consistent color scheme across visualizations to help readers quickly identify key themes. I used blue for methodological terms, green for application areas, and red for emerging concepts. This small touch markedly improved my visual’s readability. 

Conclusion 

This journey through bibliometric analysis has transformed how I approach research. From crafting precise questions to interpreting network visualizations, these methods bring clarity to complex literature landscapes. The technical hurdles are real but manageable – the payoff in insights is worth the effort. 

For those just starting, I recommend beginning with a small pilot study, perhaps analyzing 100-200 papers on a focused topic. The skills build quickly. 

I’d love to hear about your experiences with bibliometrics or help troubleshoot any challenges you encounter. Feel free to reach out at contact@rd-amoako.com or continue the conversation on research forums and other online platforms. Let’s explore how these methods can advance our evaluation and research  practice together. 

Interested in seeing the results of my bibliometric analysis and exploring the key findings? Connect with me via LinkedIn  or my blog. 

View an interactive map of publication counts by country from my project:  publications_map.html  

Bibliography 

an Eck, N. J., & Waltman, L. (2014). Visualizing bibliometric networks. In Y. Ding, R. Rousseau, & D. Wolfram (Eds.), Measuring scholarly impact: Methods and practice (pp. 285–320). Springer. 

Aria, M. & Cuccurullo, C. (2017) bibliometrix: An R-tool for comprehensive science mapping analysis, Journal of Informetrics, 11(4), pp 959-975, Elsevier. 

Donthu, N., Kumar, S., Mukherjee, D., Pandey, N., & Lim, W. M. (2021). How to conduct a bibliometric analysis: An overview and guidelines. Journal of Business Research, 133, 285–296. https://doi.org/10.1016/j.jbusres.2021.04.070 

Liu, A., Urquía-Grande, E., López-Sánchez, P., & Rodríguez-López, Á. (2023). Research into microfinance and ICTs: A bibliometric analysis. Evaluation and Program Planning, 97, 102215. https://doi.org/10.1016/j.evalprogplan.2022.102215 

Van Raan, A. F. J. (2018). Measuring science: Basic principles and application of advanced bibliometrics. In W. Glänzel, H. F. Moed, U. Schmoch, & M. Thelwall (Eds.), Handbook of science and technology indicators. Springer. 

Waltman, L., Calero-Medina, C., Kosten, J., Noyons, E. C. M., Tijssen, R. J. W., Van Eck, N. J., & Wouters, P. (2012). The Leiden Ranking 2011/2012: Data collection, indicators, and interpretation. Journal of the American Society for Information Science and Technology, 63(12), 2419–2432. https://doi.org/10.1002/asi.22708 

Yao, S., Tang, Y., Yi, C., & Xiao, Y. (2022). Research hotspots and trend exploration on the clinical translational outcome of simulation-based medical education: A 10-year scientific bibliometric analysis from 2011 to 2021. Frontiers in Medicine, 8, 801277. https://doi.org/10.3389/fmed.2021.801277 

Zupic, I., & Čater, T. (2014). Bibliometric Methods in Management and Organization. Organizational Research Methods, 18(3), 429-472. https://doi.org/10.1177/1094428114562629 

 Resources: 

  • Bibliometrix Tutorial 
  • Scopus API Guide 
  • VOSviewer 
  • CiteSpace Manual  

Data Screening  

Abstractr- https://www.youtube.com/watch?v=jy9NJsODtT8 

Convidence.org- https://www.youtube.com/watch?v=tPGuwoh834A 

Rayyan.ai- https://www.youtube.com/watch?v=YFfzH4P6YKw&t=9s 

AsReview- https://www.youtube.com/watch?v=gBmDJ1pdPR0 

Nested-knowledge- https://www.youtube.com/watch?v=7xih-5awJuM 

R resources:  

My project repository https://github.com/amoakor/BibliometricAnalysis.git 

Packages: 

-tidyverse, – bibliometrix, – rscopus, -janitor 

-pysch, -tm 

httr package documentation: https://httr.r-lib.org/, https://github.com/r-lib/httr 

Analyzing & Visualizing Data 

  • Key Metrics to Explore (See the Bibliometrix Tutorial for more examples): 
  1. Citation Analysis: 

citations <- citations(M, field = “article”, sep = “;”) 

head(citations$Cited, 10) # Top 10 most cited 

  1. Co-authorship Networks: 

networkPlot(M, normalize = “salton”, type = “collaboration”) 

  1. Keyword Trends: 

conceptualStructure(M, field = “ID”, method = “CA”, minDegree = 10) 

Filed Under: Evaluation Methodology Blog

Power BI, Will It Really Give Me Data Viz Superpowers?

Power BI, Will It Really Give Me Data Viz Superpowers?

May 15, 2025 by Jonah Hall

Power BI, Will It Really Give Me Data Viz Superpowers?

What is Power BI?

Power BI is a powerful tool to visualize data.  

It can take multiple large datasets, put them all together, transform them, perform calculations and help you create beautiful visualizations. Think of it as a data wrangler, organizer, and visualizer! Oftentimes, a collection of visualizations is created into a report.  

My name is Jake Working, I am a third-year student in the ESM PhD program at UTK and primarily use Power BI in my day job as a Data Analyst for Digital Learning at UTK. I will briefly discuss some of Power BI’s main functions and point you towards some resources if you want to learn more. 

Why use a data viz software? 

Before we jump into the software, you may be thinking, “why go through all the trouble of learning another software just to create visualizations? Aren’t my [insert your software of choice here] visualizations good enough?” 

Even when you get comfortable and quick in [your software of choice], at the end of the day, these programs’ primary functions are typically to store, present, or analyze your data, not bringing in data with the purpose of creating visualizations. 

The advantage of learning data visualization software like Power BI is that it is designed with visualization as its primary purpose. If you have learned or even mastered creating visuals in another software, you can 100% learn and master visualization software like Power BI. 

What can Power BI do? 

First, Power BI is excellent at bringing in data. You can connect multiple large and different types of data sources to Power BI, transform them, and perform calculations as necessary to prepare visuals. 

For data sources, if you can access the data, Power BI can connect to or import it. Power BI can take flat files (ex. Excel, PDF, or CSV), pull direct (snapshot or live) from a database (ex. MySQL, Oracle, SQL Server), import from a website, R script, Python script, and so many more! Even if you have multiple data sources, you can load as many as you need in and create relationships between your data sources.  

Creating relationships serves as the backbone of your data model if you have multiple data sources. For example, say you have a data source with student demographic data and another with student course information. If both contain a unique identifier, such as their student ID, you can create a relationship between the data sources based on that student ID and Power BI will know which course information connects with which student in your demographic data.  

Most of the mistakes within building a model occur at this step, and it is important to understand how and why you are building your model in a certain way or else you could sluggish, incorrect, or confusing output. I suggest reading Microsoft’s overview of relationships and then later this two-part blog post on Power BI data modeling best practices (part 1, part 2). Warning! This blog post is overly detailed for beginners, but extremely important information to avoid common Power BI pitfalls with relationships. I have had to deal with, and overcome, issues related to cardinality, filtering, and schema structure that are discussed in the blog.  

An overview of Power BI’s capabilities: bringing in multiple sources of data, cleaning data, creating relationships between data sources, and using the data to generate a visual report. 

Once you have identified your dataset, Power BI has abilities to transform your data into clean, workable, data within their Power Query editor. This editor has functionalities like Excel such as updating data types, replacing values, creating new columns, and pivoting data. This is done using the Power Query GUI or its script language, M. These transformation steps can be “saved” to your data source and performed on your data each time Power BI connects to or updates that data source. So, once you have cleaned up your data once, it is done automatically using the steps you already created! 

Power BI can then do complex calculations on your dataset once you’ve loaded it in. It uses a function and reference library called Data Analysis Expressions (DAX, for short) that is like expressions used in Excel. Check out Microsoft’s overview of how DAX can be used within Power BI and the library of DAX functions. In my use within Power BI, I mainly use calculated columns and measures.  

For example, let’s say I have a column in my data set that shows the date a form was submitted in this format: mm/dd/yyyy hr:min:sec. If I want to count the number of forms submitted in the calendar year 2025 and display that value on my report, I can create a measure using the DAX functions. It would look something like this: 

Finally, Power BI’s main function is to create engaging visuals and reports to infer information from your data. Power BI has a workspace that allows you to easily select visuals, drag fields from your data into the visuals, and then edit or customize your visuals. The software is pre-loaded with many useful visuals, but you can search and download additional, user-created, visuals as well. Check out the image below showcasing Power BI’s workspace. 

image from Microsoft (source) 

Visuals can be used together (like in the image) to create a report. These reports can be published in a shareable environment through the Power BI Service so others can view the report. This is how companies create and distribute data reports! 

One exciting feature of Power BI is the ability to use and interact with Microsoft’s AI, Copilot. Copilot is quite intelligent when it comes to understanding and using data and can even help build visuals and whole reports. Check out this three minute demo on Copilot within Power BI to get a sense of its capabilities. 

I want to try! 

If you are interested in poking around Power BI to see if it could be useful for you, you can download the desktop version for free here. I will note that even if you are working on personal projects and have data you want to create visuals from, it may be worth it to try Power BI! 

Microsoft has training, videos, sample data you can play with once you open the program, and a community forum to help with any questions you may have.  

Curious what Power BI can do? Check out some of the submissions from this year’s Microsoft’s Power BI Visualization World Championships! 

Filed Under: Evaluation Methodology Blog

Empathy in Evaluation: A Meta-Analysis Comparing Evaluation Models in Refugee and Displaced Settings

Empathy in Evaluation: A Meta-Analysis Comparing Evaluation Models in Refugee and Displaced Settings

March 15, 2025 by Jonah Hall

Empathy in Evaluation: A Meta-Analysis Comparing Evaluation Models in Refugee and Displaced Settings

By Dr. Fatima T. Zahra

Hello, my name is Fatima T. Zahra. I am an Assistant Professor of Evaluation, Statistics, and Methodology at the University of Tennessee, Knoxville. My research examines the intersection of human development, AI, and evaluation in diverse and displaced populations. Over the past decade, I have worked on projects that explore the role of evaluation in shaping educational and labor market outcomes in refugee and crisis-affected settings. This post departs from a purely technical discussion to reflect on the role of empathy in evaluation practices—a quality that is often overlooked but profoundly consequential. For more information about the work that I do check out my website. 

Evaluation is typically regarded as an instrument for assessing program effectiveness. However, in marginalized and forcibly displaced populations, conventional evaluation models often fall short. Traditional frameworks prioritize objectivity, standardized indicators, and externally driven methodologies, yet they frequently fail to capture the complexity of lived experiences. This gap has spurred the adoption of empathy in evaluation, particularly participatory and culturally responsive frameworks that prioritize community voices, local knowledge, and equitable power-sharing in the evaluation process. The work in this area is substantially underdeveloped. 

A group selfie taken during field work in the Rohingya refugee camps in 2019.

Why Does This Matter?

My recent meta-analysis of 40 studies comparing participatory, culturally responsive, and traditional evaluation models in refugee and displaced settings underscores the importance of empathy-driven approaches. Key findings include: 

  • Participatory evaluations demonstrated high levels of community engagement, with attendance and participation rates ranging from 71% to 78%. Evaluations that positioned community members as co-researchers led to greater program sustainability. 
  • Culturally responsive evaluations yielded statistically significant improvements in mental health outcomes and knowledge acquisition, particularly when interventions incorporated linguistic and cultural adaptations tailored to participants’ lived experiences. 
  • Traditional evaluations exhibited mixed results, proving effective in measuring clinical outcomes but demonstrating lower engagement (54% average participation rate), particularly in cases where community voices were not integrated into the evaluation design. 

The sustainability of programs was not dictated by evaluation models alone but was strongly influenced by community ownership, capacity building, and system integration. Evaluations that actively engaged community members in decision-making processes were more likely to foster lasting impact. 

Lessons from the Field

In our research on early childhood development among Rohingya refugees in Bangladesh, initial evaluations of play-based learning programs suggested minimal paternal engagement. However, when we restructured our approach to include fathers in defining meaningful participation—through focus groups and storytelling sessions—engagement increased dramatically. This shift underscored a critical lesson: evaluation frameworks that do not reflect the lived realities of marginalized communities risk missing key drivers of success. 

Similarly, in a study examining the impact of employment programs in refugee camps, traditional evaluations focused primarily on income and productivity, overlooking the psychological and social effects of work. By incorporating mental well-being as a key evaluation metric—through self-reported dignity, purpose, and social belonging—we found that employment offered far more than economic stability. These findings reinforce an essential principle: sustainable impact is most likely when evaluation is conducted with communities rather than on them, recognizing the full spectrum of human needs beyond economic indicators. 

Rethinking Evaluation: A Call for Change

To advance the field of evaluation, particularly in marginalized and displaced settings, we must adopt new approaches: 

  1. Power-sharing as a foundational principle. Evaluation must shift from an extractive process to a collaborative one. This means prioritizing genuine co-creation, where communities influence decisions from research design to data interpretation. 
  1. Cultural responsiveness as a necessity, not an afterthought. Effective evaluation requires deep listening, linguistic adaptation, and recognition of cultural epistemologies. Without this, findings may be incomplete or misinterpreted. 
  1. Expanding our definition of rigor. Methodological validity should not come at the expense of community relevance. The most robust evaluations integrate standardized measures with locally grounded insights. 
  2. Moving beyond extractive evaluation models. The purpose of evaluation should extend beyond measuring impact to strengthening local capacity for continued assessment and programmatic refinement. 

Looking Ahead

The field of evaluation stands at a pivotal juncture. Traditional approaches, which often prioritize external expertise over local knowledge, are proving inadequate in addressing the complexity of crisis-affected populations. Empathy in evaluation (EIE) methodologies—those that emphasize cultural adaptation, power-sharing, and stakeholder engagement—offer a path toward more just, effective, and sustainable evaluation practice. 

For scholars, this shift necessitates expanding research on context-sensitive methodologies. For practitioners, it demands a reimagining of evaluation as a process that centers mutual learning rather than imposing external standards. For policymakers and funders, it calls for investment in evaluation models that are adaptive, participatory, and aligned with the needs of affected populations. 

As evaluators, we hold a critical responsibility. We can either reinforce existing power imbalances or work to build evaluation frameworks that respect and reflect the realities of the communities we serve. If we aspire to generate meaningful knowledge and drive lasting change, we must practice empathy, cultural responsiveness, and community engagement at the core of our methodologies. 

Additional Resources

For those interested in deepening their understanding of these concepts, I highly recommend the following works: 

  • Evaluation in Humanitarian Contexts:  
  • Mertens, D. M. (2009). Transformative Research and Evaluation. Guilford Press. 
  • Culturally Responsive Evaluation:  
  • Hood, S., Hopson, R. K., & Kirkhart, K. E. (2015). Culturally Responsive Evaluation. In K. E. Newcomer, H. P. Hatry, & J. S. Wholey (Eds.), Handbook of Practical Program Evaluation (4 ed., pp. 281-317). Jossey-Bass. https://doi.org/10.1002/9781119171386.ch12 
  • Participatory Research in Development Settings:  
  • Chouinard, J.A., Cousins, J.B. The journey from rhetoric to reality: participatory evaluation in a development context. Educ Asse Eval Acc 27, 5–39 (2015). https://doi.org/10.1007/s11092-013-9184-8 
  • Empathy in Evaluation:  
  • Zahra, F. T. (n.d.). Empathy in Evaluation. https://www.fatimazahra.org/blog-posts/Blog%20Post%20Title%20One-gygte 
  • Empathy and Sensitivity to Injustice:  
  • Decety, J., & Cowell, J. M. (2014). Empathy and motivation for justice: Cognitive empathy and concern, but not emotional empathy, predict sensitivity to injustice for others (SPI White Paper No. 135). Social and Political Intelligence Research Hub. https://web.archive.org/web/20221023104046/https://spihub.org/site/resource_files/publications/spi_wp_135_decety.pdf 

Final Thought: Evaluation is a mechanism for empowerment and is more than just an assessment tool. Evaluators have the capacity to amplify community voices, shape equitable policies, and drive sustainable change. The question is not whether we can integrate empathy into our methodologies, but whether we choose to do so.  

Filed Under: Evaluation Methodology Blog

Is Your Data Dirty? The Importance of Conducting Frequencies First

Is Your Data Dirty? The Importance of Conducting Frequencies First

March 1, 2025 by Jonah Hall

Is Your Data Dirty? The Importance of Conducting Frequencies First

By Jennifer Ann Morrow, Ph.D.

Data, like life, can be messy. I’ve worked with all types of data, both collected by me and by my clients, for over 25 years and I ALWAYS check my data before conducting my proposed analyses. Sometimes, this part of the analysis process is quick and easy but most of the time it’s like an investigation…you need to be thorough, take your time, and provide evidence for your decision making. 

Data Cleaning Step 3: Perform Initial Frequencies 

After you have drafted your codebook and analysis plan you should conduct frequencies on all of your variables in your dataset, both numeric and string variables. I typically use Excel or SPSS to do this, my colleague Dr. Louis Rocconi prefers R, but you can use any statistical software that you feel most comfortable with. At this step I conduct frequencies and request graphics (e.g., bar chart, histogram) for every variable. This output will be invaluable as you work through your next data cleaning steps. 

So, what should you be looking at when reviewing your frequencies? One thing that I will make note of is any discrepancies in coding between my data and what is listed in my codebook. I’ll flag any spelling issues in my variable names/labels and note anything that doesn’t match my codebook. One thing that I always check is that my value labels (what labels are given to my numeric categories) are the same as my codebook and consistent across sets of variables. Many times, if you are using an online survey software package to collect your data there can easily have been programming mistakes when creating the survey that results in mislabeled values. Also, if you have had many individuals enter data into your database it can increase the chances that mistakes were made during the data entry process. During this step I will also check to make sure that I have properly labeled any values that I’m using to designate missing data and that this is consistent with what I have listed in my codebook.  

Lastly, I will highlight when I see variables that may have extreme scores (i.e., potential outliers), variables with more than 5% missing data, and variables with very low sample size in any of their response categories. I’ll use this output in future data cleaning steps to aid in my decision making on variable modification. 

Data Cleaning Step 4: Check for Coding Mistakes 

At this step I will take my output that I highlighted potential issues with coding and start reviewing and making variable modification decisions at this step. Coding issues are more common when you have data that has been manually entered but you can still have coding errors in online data collection! Any variables that have coding issues I first determine if I can verify the data from the original/another source. For data that has been manually entered I’ll go back to the organization/paper survey/data form to verify the data. If it needs to be changed to the correct response I will make a note of this to fix in my next data cleaning step. If I cannot verify the datapoint (like when you have collected your data anonymously) and the value doesn’t fall in the possible values listed in my codebook then I make a note to set the value as missing when I get to the next data cleaning step.  

Additional Advice 

As I am going through my frequencies I will highlight/enter notes directly in the output to make things easier as I move forward through the data cleaning process. I’ll also put notes in my project notebook summarizing any issues and then once I make decisions on variable modifications, I note these in my notebook as well. You will use the output from Step 3 in the next few data cleaning steps to aid in your decision making so keep it handy! 

Resources

12 Steps of Data Cleaning Handout: https://www.dropbox.com/scl/fi/x2bf2t0q134p0cx4kvej0/TWELVE-STEPS-OF-DATA-CLEANING-BRIEF-HANDOUT-MORROW-2017.pdf?rlkey=lfrllz3zya83qzeny6ubwzvjj&dl=0 

Step 1: https://cehhs.utk.edu/elps/organizing-your-evaluation-data-the-importance-of-having-a-comprehensive-data-codebook/ 

Step 2: https://cehhs.utk.edu/elps/clean-correlate-and-compare-the-importance-of-having-a-data-analysis-plan/ 

https://davenport.libguides.com/data275/spss-tutorial/cleaning

https://libguides.library.kent.edu/SPSS/FrequenciesCategorical

https://www.datacamp.com/tutorial/tutorial-data-cleaning-tutorial

https://www.geeksforgeeks.org/frequency-table-in-r

https://www.goskills.com/Excel/Resources/FREQUENCY-Excel

Filed Under: Evaluation Methodology Blog

Giving Yourself Room to Grow is Critical to Long-Term Wellbeing, and In Turn, Success

Giving Yourself Room to Grow is Critical to Long-Term Wellbeing, and In Turn, Success

February 15, 2025 by Jonah Hall

Giving Yourself Room to Grow is Critical to Long-Term Wellbeing, and In Turn, Success

By M. Andrew Young

We’ve all heard (and likely said) “Nobody’s perfect!”, but do we really know how to give ourselves (and others) the proper amount of empathy? 

Hello, my name is M. Andrew Young. I’m a third-year Ph.D. student in the Evaluation, Statistics and Methodology program in the Educational Leadership & Policy Studies department at the University of Tennessee. For the past 5 years now, I have served as a higher education evaluator as a Director of Assessment. In every job I’ve had since I graduated from my undergraduate degree in 2011, I have always weaved the use of data into the fabric of my work tasks, and this degree program and the field of evaluation is my happy place. I’d like to divert from the ‘normal’ type of technical blog posts I’ve written in the past and share something a bit more personal. 

I’ve noticed that in higher education, particularly in graduate and professional programs, there are a lot of highly conscientious people. I am one of them. This anecdotal observation or generalization extends to faculty, staff, and students alike. A year ago, I was doing some research on the changing landscape of evaluation and assessment career skills, and when I looked at how much the landscape has changed post-pandemic, I was astounded how rapidly the culture, values, and demands in the workplace had shifted (see this resource included in my reference section for more info, even though it is even becoming outdated: Essential Post-Pandemic Skills | ACCA Global, 2021).  

The laws of physics demand that for every action there is an equal and opposite reaction, and I have noticed that oftentimes, being conscientious, which is a good thing, is counterbalanced by its less-useful companion: high levels of self-imposed demands for excellence or even perfection. In 2021, Forbes magazine released an article called “Why Failure is Essential to Success” (Arruda, 2021). It is a really good read, and their interview with Dr. Sam Collins was eye-opening. The basic premise is that our culture celebrates and glorifies success; we even idolize overcoming adversity success stories, but we rarely see the numerous and deep failures those success stories encountered along their road to success. We love victory, but do not fully feel the depths of the pain, depression even, or discouragement they waded through along the journey.  

People like me are often so concerned with getting it right the first time and setting a personal standard so high that when we can’t attain it, we immediately sink into an unproductive self-deprecating, self-condemnatory internal dialogue. Doubts gnaw at our own self-concept of our worth and capabilities to succeed, and there is an insidious voice telling us to give up, that we aren’t capable of succeeding, that we are alone or unique in our struggles, and that the effort we put into it won’t result in anything other than wasting our time we could be using by just being satisfied with our current status-quo. 

It is incredible how we can grow without even noticing it in the moment. Let me tell you about Andrew 10 years ago. Andrew worked for a web design and marketing consulting company. The hours were long, the pay was abhorrently low for the job title I had, and I was unhappy and out of my element. The original job I was hired to do was create data visualizations for marketing surveys. It morphed into learning survey instrument development, data cleaning, statistical analysis, search engine marketing, search engine optimization, and website quality assurance. I was not ready for the work because I was not properly trained nor supported by professional development for what I would encounter. I made a LOT of mistakes, and I was unhappy. I recall a conversation with my then supervisor. It was one of those uncomfortable conversations where my work quality didn’t measure up to the demands of the job or their expectations. We were speaking about data visualization, and they gave me a scenario of a creative way to visualize geographical map information. Something was said along the lines of, “This is the type of stuff we are looking for”, and my response was, “I don’t know that I am capable of thinking up those things on my own”.  

When I reflect on that moment, I chuckle at how simplistic that data solution was within the context of my current knowledge. When I look at the types of data analyses I’m capable of and knowledge I possess now through the lens of what I was capable of only two years ago, I can see the growth. When I look at the quality of my work today compared to in the past, distant and recent, there is growth. As a parent of school-aged children now, I see the incredible pressures this culture levies on immediate success and high performance. My middle child, who is four years younger than her older sister, has unrealistic expectations of her own capabilities and limitations, and often finds herself at a comparative disadvantage to her sister. Both my school-aged children have been asked to perform tasks, to which they fail or don’t perform to their level of desire or expectations, and when asked to do it again they’ve huffed in frustration and despair, “I can’t do that, dad!”, to which I always reply, “No. You can’t yet. You CAN figure it out!” 

Oh, if I had learned that lesson earlier in my life. Sometimes we have families with impossible expectations for us. Sometimes we work for employers who want us to perform at a high level, never make mistakes, and are waiting with the hammer held twitchingly above our heads, ready for us to fail. Sometimes our educational system is designed to grind us through the mill at their speed when we really need to back up and master foundational things….the list goes on. 

Let me assure you of some things: you will disappoint those you love. You will make an embarrassing mistake at your job. You will misunderstand a school assignment and get a bad grade. You will send that email or chat message that you didn’t think through well enough. You will forget a deadline. You will get turned down for that promotion. You will receive rejection letters for almost all of those “dream jobs” with the nice salaries you’ve applied for.  

And that’s ok.

Embrace failure. It isn’t the end; it is an opportunity to learn and grow. 

Embrace chuckling at the simpleton’s drivel you produced “back when”; you were proud of it then because it was what you were capable of then.

Pursue growth, not perfection; every project and every challenge are opportunities to get better, so embrace where you’re at.

Finally, never get comfortable. Life is a journey, not a destination, and if we ever deceive ourselves into thinking that we can rest on our laurels, we stop growing. It takes an oak tree a hundred years to tower over its peers. Do you see it now? If we recognize that our journey is about growth, it is ok to be where we are and recognize that growth takes time and persistence.

Cool Extra Resources:

A UTK Class I HIGHLY recommend to study student success: ELPS 595: Student Success in Higher Education 

A book that was instrumental for me understanding wellbeing/belonging/success:  

Quaye, S. J., Harper, S. R., & Pendakur, S. L. (Eds.). (2020). Student engagement in higher education: Theoretical perspectives and practical approaches for diverse populations (Third edition). Routledge. 

Wellbeing/Strengths Assessments: 

Gallup Clifton Strengths: https://www.gallup.com/cliftonstrengthsforstudents/ 

EdResearch for Action: https://edresearchforaction.org/research-briefs/evidence-based-practices-for-assessing-students-social-and-emotional-well-being-2/  

 
Full Reference List: 

Arruda, W. (2021, December 10). Why Failure Is Essential To Success. https://www.forbes.com/sites/williamarruda/2015/05/14/why-failure-is-essential-to-success/ 

Essential post-pandemic skills | ACCA Global. (2021). https://www.accaglobal.com/lk/en/affiliates/advance-ezine/careers-advice/post-pandemic-skills.html 

Evidence-Based Practices For Assessing Students’ Social And Emotional Well-Being. (n.d.). EdResearch for Action. Retrieved January 5, 2025, from https://edresearchforaction.org/research-briefs/evidence-based-practices-for-assessing-students-social-and-emotional-well-being-2/ 

Quaye, S. J., Harper, S. R., & Pendakur, S. L. (Eds.). (2020). Student engagement in higher education: Theoretical perspectives and practical approaches for diverse populations (Third edition). Routledge. 

Singh, A. (2021, August 23). The top data science skills for the post-Covid world. https://www.globaltechcouncil.org/data-science/the-top-data-science-skills-for-the-post-covid-world/ 

Filed Under: Evaluation Methodology Blog

Clean, Correlate, and Compare: The Importance of Having a Data Analysis Plan

Clean, Correlate, and Compare: The Importance of Having a Data Analysis Plan

February 7, 2025 by Jonah Hall

Clean, Correlate, and Compare: The Importance of Having a Data Analysis Plan

By Dr. Jennifer Ann Morrow

Data Cleaning Step 2: Create a Data Analysis Plan

Hi again! For those that read my earlier blog on Data Cleaning Step 1: Create a Data Codebook, you know I love data cleaning! My colleagues, Dr. Louis Rocconi and Dr. Gary Skolits, love to nerd out and talk about data cleaning and why it is such an important part of analyzing your evaluation data. As I mentioned in my earlier blog post before we can tackle addressing our evaluation or assessment questions, we need to get our data organized. Creating a data analysis plan is an important part of the data management process. Once I create my first draft of my data codebook (Step 1), I draft a data analysis plan…and both of these get updated as I make changes to my evaluation/assessment dataset. 

Why a Data Analysis Plan?

While it can be tempting to just dive right on in and conduct your proposed analyses (I mean who doesn’t just want to run a multiple regression right away?!?) it’s good practice to have a detailed plan for how you intend to clean your data and how you will address your evaluation/assessment questions. Creating a data analysis plan BEFORE you start working with your dataset helps you think through the data that you need to collect to address your questions, what specific pieces of the data that you will use to address your questions, how you will analyze the data that you collect, and what are the most appropriate ways to disseminate the data that you analyze. While creating a data analysis plan can be time consuming, it is an invaluable part of the data management and analysis process. Also, if you are working with a team (as many of us evaluator/assessment professional do!) it makes collaboration, replication, and report generation easier. Just like the data codebook, the data analysis plan is a living document that changes as you make decisions and modifications to your dataset and planned analyses.  

I share the data analysis plan with my clients throughout the life of the project so they are aware of the process but also so they can chime in if they have questions or requests for different ways to approach the analysis of their data. At the end of my time with the project I routinely share a copy of the data codebook, data analysis plan, and a cleaned/sanitized dataset for the client to continue to use to inform their program and organization. 

What is in a Data Analysis Plan?

Whether you create your data analysis plan in Excel, Word, or some other software platform (I tend to prefer Word) these are my suggestions for what you should include in a data analysis plan: 

  • 1.) General Instructions to Data Analysts
  • 2.) List of Datasets for the Project
  • 3.) Who is Responsible for Each Section of the Analysis Plan
  • 4.) Evaluation/Assessment Questions
  • 5.) Variables that You Will Use in Your Analyses
  • 6.) Step by Step Description of Your Data Cleaning Process
  • 7.) Specific Analyses that You Will Use to Address Each Evaluation/Assessment Question
  • 8.) Proposed Data Visualizations that You Will Use for Each Analysis
  • 9.) Software Syntax/Code (e.g., SPSS, R) that You Will Use to Analyze Your Data

Since many times there are multiple people working with my datasets (Boy…did it take me a long time to get used to giving up control here!) including step by step instructions for how your data analysts should name, label, and save files is extremely important. Also providing guidance for how data analysts should document what they do (see project notebook in your data codebook!) and how they arrived at their decisions is invaluable for keeping the evaluation/assessment team aware of each step of the data analysis process. 

I typically organize my data analysis plan by first listing any data cleaning that needs to be completed followed by each of my evaluation/assessment questions. This way all of my analyses are organized by the questions that my client wants me to address…and this helps immensely when writing up my evaluation/assessment report for them.  

Including either the software syntax/code (if using something like SPSS or R) or the step-by-step approach to how you are using the software tool (if using something like Excel) to clean and analyze the data is so helpful to not only your team members but also your clients. It allows them to easily rerun analyses and critique the steps that you took to analyze the data. I also include in my syntax/code notes about my decision-making process so anyone can easily follow how and why I approached the analyses the way that I did. 

Additional Advice

While it is important to develop your data analysis plan early in your project always remember that it is a living document and it will definitely change as you are collecting data, meeting with your client to discuss the evaluation/assessment, and during the data cleaning process. Your “perfect” plan may not work once you have collected your data, so be flexible in your approach. Just remember to document any changes that you make to the plan and to your data in your project notebook! 

Resources

12 Steps of Data Cleaning Handout: https://www.dropbox.com/scl/fi/x2bf2t0q134p0cx4kvej0/TWELVE-STEPS-OF-DATA-CLEANING-BRIEF-HANDOUT-MORROW-2017.pdf?rlkey=lfrllz3zya83qzeny6ubwzvjj&dl=0 

http://fogartyfellows.org/wp-content/uploads/2015/09/SAP_workbook.pdf 

https://cghlewis.com/blog/project_beginning

https://learn.crenc.org/how-to-create-a-data-analysis-plan

https://pmc.ncbi.nlm.nih.gov/articles/PMC4552232/pdf/cjhp-68-311.pdf

https://the.datastory.guide/hc/en-us/articles/360003250516-Creating-Analysis-Plans-for-Surveys

https://www.slideshare.net/slideshow/brief-introduction-to-the-12-steps-of-evaluagio/26168236#1

https://www.surveymonkey.com/mp/developing-data-analysis-plan

https://youtu.be/105wwMySZYc?si=9SEqjP2HWB5k4MDn

https://youtu.be/djVHKjmImrw?si=BdfSxl6C4weZEOgD

Filed Under: Evaluation Methodology Blog

Grant Writing in Evaluation

Grant Writing in Evaluation

January 15, 2025 by Jonah Hall

Grant Writing in Evaluation

By Jessica Osborne, Ph.D.

Jessica is the Principal Evaluation Associate for the Higher Education Portfolio at The Center for Research Evaluation at the University of Mississippi. She earned a PhD in Evaluation, Statistics, and Measurement from the University of Tennessee, Knoxville, an MFA in Creative Writing from the University of North Carolina, Greensboro, and a BA in English from Elon University. Her main areas of research and evaluation are undergraduate and graduate student success, higher education systems, needs assessments, and intrinsic motivation. She lives in Knoxville, TN with her husband, two kids, and three (yes, three…) cats. 

I’ve always been a writer. Recently, my mother gave (returned to) me a small notebook within which I was delighted to find the first short story I ever wrote. In blocky handwriting with many misspelled words, I found a dramatic story of dragons, witches, and wraiths, all outsmarted by a small but clever eight-year-old. The content of my writing has changed since then, but many of the rules and best practices remain the same. In this blog, I’ll highlight best practices in grant writing for evaluation, including how to read and respond to a solicitation, how to determine what information to include, and how to write clearly and professionally for an evaluation audience.  

As an evaluator, you can expect to respond to proposals in many different fields or content areas: primary, secondary, and post-secondary education, health, public health, arts, and community engagement, just to name a few. The first step in any of these scenarios is to closely and carefully read the solicitation to ensure you have a deep understanding of project components, requirements, logistics, timeline, and, of course, budget. I recommend a close reading approach that includes underlining and / or highlighting the RFP text and taking notes on key elements to include in your proposal. Specifically, pay attention to the relationship between the evaluation scope and budget and the contexts and relationships between key stakeholders. In reviewing these elements and determining if and how to respond, make sure you see alignment between what the project seeks to achieve and your (or your team’s) ability to meet project goals. Also, be sure to read up on the funder (if you are not already familiar) to get a sense of their overarching mission, vision, and goals. Instances when you may not want to pursue funding include a lack of alignment between the project scope / budget and your team’s capacity or conflicts between you and the funder’s ethics, legal requirements, or overarching vision and mission.     

Grant writing in evaluation typically takes two forms: responding as a prime (or solo) author to a request for proposal (RFP) or writing a portion of the proposal as a grant subrecipient. The best practices mentioned here are relevant for either of these cases; however, if working on a team as a subrecipient, you’ll also want to match your writing tone and style to the other authors.  

When responding to an RFP, your content should evidence that you know and understand:  

  • the funder – who they are; why they exist; 
  • the funder’s needs – what they are trying to accomplish; what they need to achieve project goals; 
  • and most importantly, that you are the right person to meet their needs and help them achieve their goals.  

For example, if you are responding to a National Science Foundation (NSF) solicitation, you will want to evidence broader impacts and meticulously detail your research-based methods (they are scientists who want to improve societal outcomes), how your project fits the scope and aims of the solicitation (the goals for most NSF solicitations are specific – be sure you understand what the individual program aims to achieve), and the background and experience for all key personnel (to evidence that you and your team can meet solicitation goals).  

When considering content, be sure to include all required elements listed in the solicitation (I recommend double and triple checking!). If requirements are limited or not provided, at minimum be sure to include:  

  • an introduction highlighting your strengths as an evaluator and how those strengths match the funder’s and / or program’s needs 
  • a project summary and description detailing your recommended evaluation questions, program logic model, evaluation plan, timeline, approach, and methods 
  • figures and tables that clearly and succinctly illustrate key evaluation elements  

When considering writing style and tone, stick to the three C’s:  

  • clear 
  • concise 
  • consistent 

To achieve the three C’s, use active voice, relatively simple sentence structure, and plain language. Syntactical acrobatics containing opaque literary devices tend to obfuscate comprehension, and, while tempting to construct, have no place in evaluation writing. Also, please remember that the best writing is rewriting. Expect and plan for multiple rounds of revision and ask a colleague or team member to revise and edit your work as well.  

And finally, a word on receiving feedback: in the world of evaluation grant writing, much like the world of academic publications, you will receive many more no’s than yes’s. That’s fine. That’s to be expected. When you receive a no, look at the feedback with an eye for improvement – make revisions based on constructive feedback and let go of any criticisms that are not helpful. When you receive a yes, celebrate, and then get ready for the real work to begin! 

Filed Under: Evaluation Methodology Blog

Finding Fit: A Statistical Journey

Finding Fit: A Statistical Journey

January 2, 2025 by Jonah Hall

Finding Fit: A Statistical Journey

By: Sara Hall

As a graduate student in Evaluation, Statistics, and Measurement, I’ve learned a thing or two about fit. Not just in terms of statistical models, but in my own academic journey and beyond. Life is kind of like running one big regression on your choices – sometimes, the model explains everything and other times is all error terms and cold coffee. Somewhere in between lies the essence of goodness of fit. In this blog post I will take you through my experience of finding the right graduate program, using some statistical concepts to illustrate my process.

The Initial Model: Leadership & Decision-Making

Two years ago, I began my graduate studies in a Leadership and Decision-making program. I had been out of the academy for 10 years. I had a successful career in sales, children old enough to reach the microwave, and a supportive group of friends that could help with childcare as well as navigating graduate school. A good friend and former colleague was teaching quantitative and qualitative analysis and methodology in a Leadership program. He encouraged me to apply with the promise that we would be working together again, and I could pursue my research interests with his support. For as long as I can remember, I have wanted to teach and do research. The timing was perfect, and this seemed like the best opportunity as a non-traditional student to at least get a PhD to teach and do research, even if not exactly in my field of interest. Two things are relevant to note:

  • My research and career goals do not include a focus on leadership and decision-making.
  • My friend accepted a position (a much better fitting one, see what I did there?) at a different university a week before classes started.

In statistics, we often talk about “goodness of fit” – how well a model describes a set of observations. My program choice was a model that looked great on the spreadsheet but failed to capture the nuances of my data, in this case, my interests and career goals. I was dealing with a poor model fit. The residuals – the differences between what I expected and what I experienced, only grew larger as the months turned into years. I was determined to see through and complete my degree, but my frustration was palpable. I was trying to fit a curvilinear model to a linear relationship. My R-squared value was disappointingly low.

Example of Poor Goodness of Fit

Notice in this exaggerated example, a curve is inappropriately used to fit a clearly linear data pattern. The strong positive linear pattern of the data points suggests that as program value increases goal opportunity also increases. The fitted curve completely misses the underlying pattern, indicating poor model fit. The R-squared value indicates the model explains none of the variance and performs about 33 times worse than if the prediction was simply based on the mean.

Reassessing the Model: Searching for a Better Fit

Just as we refine our statistical models when they fail to adequately explain our data, I concluded I needed to reassess my academic path. The final straw was being told that theory was less important than application while I was working feverishly to map a theory of identity deconstruction that could be generalized to various populations for use in clinical settings. As atheoretical methodologist who values the balance of theory and action, it was a kick in the gut. Turns out it was just what I needed. I began talking to friends whose interests aligned with mine, reaching out to professors and mentors for advice, and really challenging myself to think through what I wanted to do with my scholarly pursuits and the potential consequences of leaving my current program. From there I began looking at different programs and creating my own information criteria (I heart Bayes!). In the same way residuals reflect the gap between outcomes and predictions, or expectations and experiences in my case, I wanted to minimize the residuals in my decision-making by selecting a program the most closely aligned with my personal and professional aspirations. I developed a framework, inspired by statistical concepts like Bayesian information criteria, to create four dimensions of alignment that were of critical importance to my decision to change programs (research, faculty, career, academic). I then used this information set to evaluate and compare the different programs based on how well they matched my interests, goals, and priorities. In this context, I viewed each program as a distinct model where specification defined how the four dimensions of alignment (research, faculty, career, and academic priorities) interact and contribute to program fit.

Here is a link to a tutorial providing the steps necessary to run Bayesian goodness-of-fit testing for regression models using R developed by Andres F. Barrientos and Antonio Canale.

The New Model: Evaluation, Statistics, & Measurement (ESM)

The ESM program immediately stood out to me. The classes were intriguing, the faculty profiles contained research focuses I wanted to explore, and the career options were many I could see myself enjoying. Specifically, the focus on creating applied learning experiences grounded in atheoretical foundation aligned well with my personal approach to both teaching and learning. I met with faculty who echoed my values while also piquing my curiosity for subject matter I had not previously considered exploring. I wanted to learn from them and I felt I could contribute positively to the program. After careful consideration, I chose to make the switch to ESM. The difference was immediately apparent – it was like finding a model with an excellent fit! I had a well-specified model, capturing the complexity of my academic aspirations without over or under fitting. The residuals between my expectations and experiences shrunk. The Radar Chart to the right compares the two programs across five dimensions of important considerations when choosing a Graduate program. The Evaluation program consistently scores higher across all dimensions, indicating better alignment with the important considerations than the Leadership program.

The Importance of Fit

Good statistical models strike a balance between simplicity and explanatory power. ESM provided the right balance of theory and application for me. Finding the right graduate program is a lot like fitting a statistical model. Graduate school is a continuous process of adaptation requiring careful analysis and sometimes, a willingness to start over. Changing programs can be a hard decision but we shouldn’t force ourselves to fit into programs that don’t align with our goals and expectations for our educational experience. My journey to ESM is a reminder that it is okay to reassess, to look for a better fit, and to make changes. Both life and regression analysis are iterative processes in which goodness of fit can influence the predicted outcomes. It is important to reflect on our experiences and take action when adjustments need to be considered. I encourage you to reflection how you define success in your graduate journey and ask, does your current path align with that definition? To hold yourself accountable try setting specific goals at the start of each semester and revisit them mid-way through to make modifications if necessary. In both statistics and graduate school, the end game is not just to find any fit, but to find the best fit. When you do, the adjusted R-squared of your experience will be higher and so will your confidence in achieving your vision of your future.

Whether you are just starting to consider graduate school, evaluating your goodness of fit in a current program, or just wanting to reflect, this YouTube video, Picking the Graduate Program that is Perfect for You, by Dr. Sharon Milgram is full of helpful advice and considerations.

About the Author

I am a current graduate student in the ESM program. My research interests include identity deconstruction and evaluating the use of AI in higher education. I love all things methodology and have passion for factor analysis.

Filed Under: Evaluation Methodology Blog

  • 1
  • 2
  • 3
  • 4
  • Next Page »

Recent Posts

  • Bartlett, McGuigan, & Miller Join ELPS this Fall as New Faculty Members
  • Morrow, Angelle, & Cervantes Recently Return from BELMAS
  • Serving with Purpose: Lessons Learned from Consulting in Assessment and Research
  • Navigating Ambiguity and Asymmetry: from Undergraduate to Graduate Student and Beyond
  • My Journey In Writing A Bibliometric Analysis Paper

Recent Comments

No comments to show.

College of Arts & Sciences

117 Natalie L. Haslam Music Center
1741 Volunteer Blvd.
Knoxville TN 37996-2600

Phone: 865-974-3241

Archives

  • August 2025
  • July 2025
  • June 2025
  • May 2025
  • March 2025
  • February 2025
  • January 2025
  • December 2024
  • November 2024
  • October 2024
  • September 2024
  • August 2024
  • July 2024
  • June 2024
  • May 2024
  • April 2024
  • March 2024
  • February 2024
  • January 2024
  • December 2023
  • November 2023
  • October 2023
  • May 2022
  • September 2021
  • August 2021
  • February 2021
  • September 2020
  • August 2020
  • June 2020
  • May 2020
  • March 2020
  • February 2020
  • November 2019
  • September 2019
  • August 2019
  • July 2019
  • June 2019
  • April 2019
  • March 2019
  • February 2019
  • January 2019
  • December 2018
  • November 2018
  • October 2018
  • August 2018
  • June 2018
  • May 2018
  • April 2018
  • February 2018
  • December 2017
  • October 2017
  • August 2017

Categories

  • Accolades
  • CEL
  • CSP
  • EDAM
  • Evaluation Methodology Blog
  • Graduate Spotlights
  • HEAM
  • Leadership Studies News
  • News
  • PERC
  • Presentations
  • Publications
  • Research
  • Uncategorized

Copyright © 2025 · UT Knoxville Genesis Child for CEHHS on Genesis Framework · WordPress · Log in

Educational Leadership and Policy Studies

325 Bailey Education Complex
Knoxville, Tennessee 37996

Phone: 865-974-2214
Fax: 865.974.6146

The University of Tennessee, Knoxville
Knoxville, Tennessee 37996
865-974-1000

The flagship campus of the University of Tennessee System and partner in the Tennessee Transfer Pathway.

ADA Privacy Safety Title IX