ACED Students & Faculty Attend 2025 AAACE Conference

ACED Students & Faculty Attend 2025 AAACE Conference
The faculty and students of the Adult & Continuing Education (ACED) PhD and master’s programs demonstrated active participation both virtually and onsite at the 2025 American Association of Adult & Continuing Education (AAACE) Annual Conference! AAACE is recognized as the leading international and national organization for adult education professionals.
The conference was held virtually on September 26th, 2025, and physically in Cincinnati, Ohio October 6th-10th. Faculty members and mentors, Qi Sun, Mitsunori Misawa, and Jennifer Kobrin not only presented their own research but also actively guided and collaborated with both PhD and master’s students on research projects. They worked closely with ACED PhD program students such as Rosite Delgado, Billie McNamara, Dan wang, Lauren Davenport, Georgette Samaras, and Steven Henley. Additionally, master’s students such as Kortney Jarman, and Janie Swanger also wrote and submitted proposals that were presented at the conference receiving positive feedback. Multiple students also presented their own research projects, gaining experience in academic writing and developing their professional presentation skills!
During the virtual conference, Qi Sun delivered a presentation on lifelong learning policy, using China’s adult and continuing education movement and reform as a context and case study to highlight emerging trends in standardization, accessibility, digital transformation, and holistic human development. Additionally, she collaborated with PhD candidate Rosite Delgado on a study titled Exploring the Multiple Dimensions of Faculty Wellness in Higher Education: A Holistic Support Approach, and with PhD student Dan Wang on their research titled Enhancing Cross-Cultural Awareness and Intercultural Communication: Experiential Learning in Teaching Chinese as a Second Language, which Dan Wang presented onsite on their behalf.


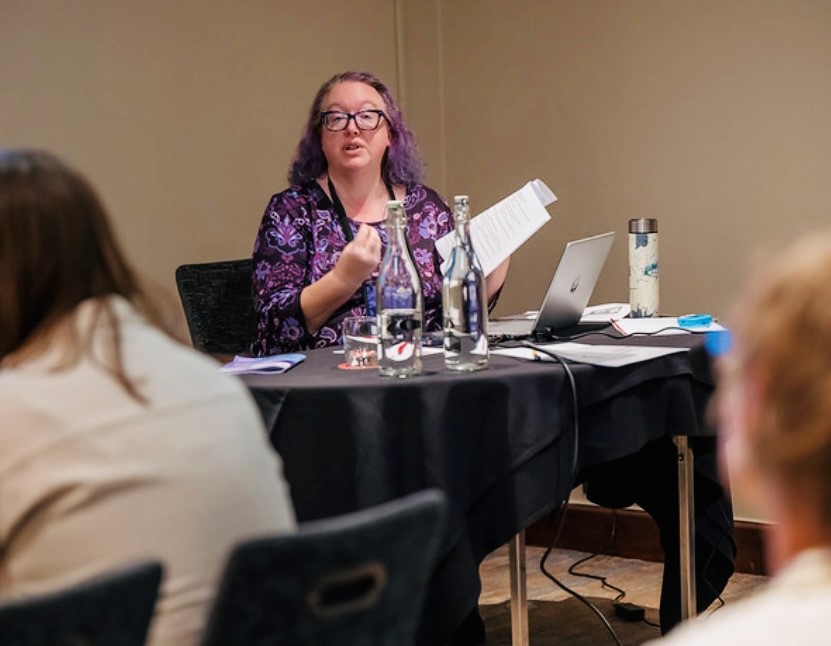
Furthermore, Kobrin and PhD student Lauren Davenport presented a session titled “From Exclusion to Empowerment: Supporting Older Adults’ Learning Technology in Nonformal Settings.” Their presentation drew from their ongoing research project exploring how older adults engage with technology, privacy, and digital literacies in community-based, nonformal learning settings. Misawa collaborated with MS graduate Kortney Jarman and co-presented: Exploring Workforce Development from Holistic Approaches, and collaborated with Janie Swanger, a Master’s degree program student, and co-presented: Self-Directed Learning in OBGYN Residency: The Intersection of Medical and Adult Education.
Some students, for example, Georgette Samaras and Billie McNamara, presented their research at respected commission sessions. Georgette Samaras presented “Mind the Gap: A Psychology Technician Pathway for Workforce Success” at the Commission for Workforce and Professional Development. Billie McNamara also presented at the Commission of International Adult Education (CIAE). Additionally, we are very proud that Billie has served as an editor for the CIAE proceedings of the AAACE annual Conference.

Misawa has recently joined the AAACE Board of Directors, serving as the Director of the Commission for Workforce and Professional Development. The annual AAACE Conference convenes educators, scholars, and practitioners from across the nation and internationally to exchange research and promote the advancement of adult and continuing education. The upcoming conference is scheduled to take place in Chattanooga, Tennessee, from October 5 to 9, 2026. The faculty anticipate the opportunity to involve more of our program students in this esteemed event!