• Request Info
  • Visit
  • Apply
  • Give
  • Request Info
  • Visit
  • Apply
  • Give

Search

  • A-Z Index
  • Map

Educational Leadership and Policy Studies

  • About
  • Our People
    • Our People Overview
    • Faculty
    • Staff
    • Students
  • Academic Programs
    • Academic Programs Overview
    • Adult & Continuing Education
    • Educational Administration
    • Evaluation Programs
    • Higher Education Administration
    • Undergraduate Studies
    • Student Affairs and Higher Education (Pending CRC Approval)
  • Education Research & Opportunity Center
  • Admissions & Information
    • Admissions Overview
    • Graduate Forms, Handbooks, and Resources
    • Contact ELPS
Home » Archives for Jonah Hall » Page 3

Learn About our Evaluation Graduate Programs at UTK!

Learn About our Evaluation Graduate Programs at UTK!

Learn About our Evaluation Graduate Programs at UTK!

November 15, 2024 by Jonah Hall

Learn About our Evaluation Graduate Programs at UTK!

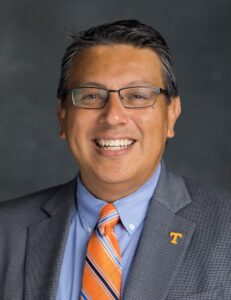
By Jennifer Ann Morrow, Ph.D.

Hi! My name is Jennifer Ann Morrow and I’m the Program Coordinator for the Evaluation Methodology MS program and an Associate Professor in Evaluation Statistics and Methodology at the University of Tennessee-Knoxville. I have been training emerging assessment and evaluation professionals for the past 23 years. My main research areas are training emerging assessment and evaluation professionals, higher education assessment and evaluation, and college student development. My favorite classes to teach are survey research, educational assessment, program evaluation, and statistics. 

Check out my LinkedIn profile: https://www.linkedin.com/in/jenniferannmorrow/  

Are you interested in the field of evaluation? Do you want to earn an advanced degree in evaluation? If your answers are yes, then check out our graduate programs in evaluation here at the University of Tennessee Knoxville. We currently offer two graduate programs, a residential PhD program in Evaluation Statistics and Methodology and a distance education MS program in Evaluation Methodology. There are numerous career paths that an evaluator can take (check out our blog post on this topic!) and earning an advanced degree in evaluation will give you the needed skill sets to be successful in our field. 

Information on the Evaluation Statistics and Methodology PhD program 

Our PhD in Evaluation Statistics and Methodology is a 90-credit residential program that typically takes 4 years to complete (students have up to 8 years to complete their degree). The ESM program is intended for students with education, social science, psychology, economics, applied statistics, and/or related academic backgrounds seeking employment within the growing fields of applied evaluation, assessment, and statistics. While our program is residential, we offer flexibility with evening, online, and hybrid courses. Our PhD program is unique in that it offers focused competency development, theory to practice course-based field experiences, theory to practice internships targeted to student interests, highly experienced and engaged faculty, and regular access to one-on-one faculty support and guidance. Applications are due on December 1st each year (priority deadline), however applicants may still apply through April 1st with the understanding that funding and space may be limited the later that one applies. Our curriculum is listed below. If you have any questions about our ESM PhD program please contact our program coordinator, Dr. Louis Rocconi. 

ESM Core Courses (15 credit hours) 

  • ESM 533 – Program Evaluation I  
  • ESM 534 – Program Evaluation II 
  • ESM 577 – Statistics in Applied Fields I 
  • ESM 677 – Statistics in Applied Fields I 
  • ESM 581 – Educational Assessment 

Advanced ESM Core (12 credit hours) 

  • ESM 651 – Advanced Seminar in Evaluation 
  • ESM 678 – Statistics in Applied Fields III 
  • ESM 680 – Advanced Educational Measurement and Psychometrics  
  • ESM 667 – Advanced Topics  

Research Core (15 credit hours) 

  • ESM 583 – Survey Research 
  • ESM 559 – Introduction to Qualitative Research in Education  
  • ESM 659 – Advanced Qualitative Research in Education  
  • ESM 682 – Educational Research Methods  
  • 3 credit hours of approved graduate research electives selected in consultation with the major advisor 

Applied Professional Experience (15 credit hours) 

  • ESM 660 (9 credit hours) – Research Seminar 
  • ESM 670 (6 credit hours) – Internship 

Electives (9 credit hours) selected in consultation with the major advisor 

Dissertation/Research (24 credit hours) 

  • ESM 600 – Doctoral Research & Dissertation  
  • Students will enroll in a minimum total of 24 credit hours of dissertation at the conclusion of their coursework. 

Information on the Evaluation Methodology Distance Education MS Program 

Our MS in Evaluation Methodology is a 30-credit distance education program where all courses are taught asynchronously. Our program prepares professionals who are seeking to enhance their skills and develop new competencies in the rapidly growing field of evaluation methodology. The program is designed to be completed in two years (6 credits, 2 classes per semester), however students may take up to six years to complete their degree. Courses in the Evaluation Methodology program are taught by experienced professionals in the field of evaluation. Our instructors work as evaluation professionals, applied researchers, and full-time evaluation faculty, many of which have won prestigious teaching awards and routinely earn positive teaching evaluations. Applications are due by July 1st each year. Check out our curriculum listed below. If you have any questions about the EM MS program please contact our program coordinator, Dr. Jennifer Ann Morrow.  

Required Courses: 27 Credit Hours 

  • ESM 533 – Program Evaluation I 
  • ESM 534 – Program Evaluation II 
  • ESM 559 – Introduction to Qualitative Research in Education 
  • ESM 560 – Evaluation Designs and Data Collection Methods 
  • ESM 570 – Disseminating Evaluation Results 
  • ESM 577 – Statistics in Applied Fields I 
  • ESM 583 – Survey Research 
  • ESM 590 – Evaluation Practicum I 
  • ESM 591 – Evaluation Practicum II 

Electives: 3 Credit Hours 

  • ESM 581 – Educational Assessment 
  • ESM 677 – Statistics in Applied Fields II 
  • ESM 672 – Teaching Practicum in Evaluation, Statistics, & Methodology 
  • ESM 682 – Educational Research Methods 
  • Or another distance education course approved by the program coordinator 

Resources: 

ESM PhD and EM MS Admission information: https://cehhs.utk.edu/elps/admissions-information/ 

ESM PhD program information: https://cehhs.utk.edu/elps/academic-programs/evaluation/evaluation-statistics-methodology-phd/ 

EM MS program information: https://cehhs.utk.edu/elps/academic-programs/evaluation/evaluation-methodology-concentration-masters-in-education-online/ 

UTK’s MAD with Measures Blog: https://cehhs.utk.edu/elps/academic-programs/evaluation/evaluation-methodology-blog/ 

UTK Graduate School: https://gradschool.utk.edu/ 

UTK Admissions for International Students: https://gradschool.utk.edu/future-students/office-of-graduate-admissions/applying-to-graduate-school/admissions-for-international-students/ 

Questions about your UTK Graduate School application: https://gradschool.utk.edu/future-students/office-of-graduate-admissions/contact-graduate-admissions/ 

UTK Vols Online: https://volsonline.utk.edu/  

Applying to graduate school: https://www.apa.org/education-career/grad/applying 

How to apply to grad school: https://blog.thegradcafe.com/how-to-apply-to-grad-school/  

Filed Under: Evaluation Methodology Blog

Hazing Prevention Study Expands

Hazing Prevention Study Expands

November 11, 2024 by Jonah Hall

Hazing Prevention Study Expands

Courtesy of the College of Education, Health, & Human Sciences

Penn State’s Timothy J. Piazza Center for Fraternity and Sorority Research has expanded a national hazing prevention study to include nine more campuses. The WhatWorks study emphasizes the prevention of hazardous drinking, hazing and other resulting behaviors, with the goal of changing student, organization and campus culture. 

The newest cohort includes Auburn University; Bowling Green State University; California Polytechnic State University, San Luis Obispo; Mississippi State University; Virginia Tech; the University of Alabama; the University of Kentucky; the University of Missouri; and the University of Tennessee. 

“This thorough volume is the result of a collaborative effort to study hazing from secondary school to higher education,” said Patrick Biddix, Professor of Higher Education at the University of Tennessee, Knoxville.  “It is one of the most comprehensive research projects on hazing prevention, featuring a new definition of hazing and clinical strategies for education and prevention. The findings are influencing national prevention initiatives like the What Works study at Penn State University and are being showcased in various national workshops and presentations.”

Portrait photo of Patrick Biddix. He has fair skin, and short, dark hair. He is wearing a light colored shirt and gray sport coat. He is smiling in the picture.

Biddix is Jimmy and Ileen Chee Endowed Professor of Higher Education in the Department of Educational Leadership and Policy Studies in the College of Education, Health, and Human Sciences. He is a leading authority in fraternity and sorority research. His 50 academic publications have been cited over 630 times by scholars and researchers.

“We’re glad to partner with the Piazza Center and our peers on this project, not only to participate in the development of best practices, but also to benefit from the research-driven principles identified,” said Steven Hood, vice president for student life at the University of Alabama. “Enhancing and supporting student safety and well-being are at the forefront of everything we do, so we consider this project important in forecasting the best path forward for universities like ours with robust fraternity and sorority communities.” 

The WhatWorks study, a partnership with the WITH US Center for Bystander Intervention at California Polytechnic State University and the Gordie Center at the University of Virginia, is designed with top prevention and content experts from behavioral health, psychology and higher education. The study allows participating campuses to implement comprehensive hazing prevention programs. Participating institutions work with the Piazza Center and partners to test and validate effective methods of hazing prevention over a three-year assessment cycle. 

“We are building campuses’ capacity to implement effective prevention that increase student safety,” said Stevan Veldkamp, executive director of Penn State’s Piazza Center, a unit in the division of Student Affairs. “The study aims to build comprehensive prevention programs and assess them with precision to ultimately eliminate life-threatening incidents.” 

The WhatWorks study is being led by Robert Turrisi, professor of biobehavioral health and prevention research at Penn State. Turrisi, along with professor of higher education at the University of Tennessee Patrick Biddix, will work with each cohort member to design research-informed prevention strategies. 

Filed Under: News

Educational Data Analytics Using R: A free, self-paced resource!

Educational Data Analytics Using R: A free, self-paced resource!

October 18, 2024 by Jonah Hall

Educational Data Analytics Using R: A free, self-paced resource!

By Louis Rocconi, Ph.D. and Joshua Rosenberg, Ph.D.

Do you work in an educational setting? Do you love using data? Do you want to learn how to use R to analyze data? If you answered yes to any of these, then we invite you to check out our new resources on Educational Data Analytics Using R.  

This resource includes materials for a future microcredential to be offered through the University of Tennessee. This post includes links to the freely-available resources. If you are interested in receiving information on the microcredential when it is available, please complete this form: https://forms.gle/aCUDpbL5nsasjJC77.  

Unlock the Power of Educational Data Analytics with R! 

We are excited to introduce our new, self-paced, free online resource, Getting Started in Educational Data Analytics Using R.  

This resource is designed to equip educational professionals with the skills needed to analyze educational data using R. Whether you are a K-12 or higher education administrator, a classroom teacher seeking to make use of their students’ data, or simply someone interested in data analytics, we hope to provide you with a solid introduction to R and its applications in educational contexts.   

Who is this for? 

This resource is designed for: 

  • K-12 and higher education leaders and analysts looking to enhance their data analysis capabilities. 
  • Teachers and professors interested in making sense of their students’ data or interested in teaching students to analyze data 
  • Undergraduate and graduate students at UTK and beyond who are interested in learning R and data analytics. 
  • Anyone seeking an introduction to data analytics, R, and its applications in education. 

No Prior Knowledge Required 

We assume no prior knowledge of programming or statistics knowledge, making it accessible to everyone. 

What can you expect? 

  • Online, Free, Self-Paced Format: Learn at your own pace, whenever and wherever it suits you. 
  • Interactive Modules: Each module is packed with: 
  • Code-along Projects: Hands-on learning with step-by-step guides. 
  • Formative Assessments: Quizzes and activities to reinforce your understanding. 
  • Engaging Content: Informative and enjoyable modules designed to keep you motivated. 
  • Learn on the go: Access the modules on your phone, tablet, or computer.  

How do I get started?  

To get started, visit our homepage or use the following links to access the individual models:  

  • Introduction to R: Get started with R: https://ed-analytics.shinyapps.io/0-1-getting-started/  
  • Foundational Skills: Build your foundational skills in R: https://ed-analytics.shinyapps.io/1-1-foundational-skills/  
  • Nuts and Bolts: Learn the nuts and bolts of R (i.e., data types, data structures, indexing): https://ed-analytics.shinyapps.io/1-2-nuts-and-bolts/  
  • Data Wrangling: Master the art of data wrangling: https://ed-analytics.shinyapps.io/2-1-data-wrangling/  
  • Tidy Data: Learn the basic principles of tidy data: https://ed-analytics.shinyapps.io/2-2-tidy-data/ 
  • Descriptive Statistics: Learn about descriptive statistics: https://ed-analytics.shinyapps.io/3-1-stats-terms/  
  • We hope you can join us on this exciting journey and unlock the potential of educational data analytics with R! If you have any questions or suggestions for improvement, please email Dr. Rocconi. We are always looking for ways to improve! For additional resources to get started using R, see the following.  
  • Additional R Resources 
  • To expand your knowledge of R, here are some other excellent resources: 
  • R for Data Science by Garrett Grolemund and Hadley Wickham: A comprehensive guide to data science with R. 
  • Hands-on Programming with R by Garrett Grolemund: A practical, hands-on approach to learning R. 
  • RStudio Education: Beginner-friendly tutorials and resources. 
  • DataCamp’s Introduction to R: An interactive course to get you started with R. 
  • R Programming for Beginners: A YouTube tutorial by edureka! covering the basics of R. 
  • GeeksforGeeks R Tutorial: A detailed introduction to R programming. 

Filed Under: Evaluation Methodology Blog

Common “Dirty Data” Problems I Encounter and How to Save Time Fixing Them

Common “Dirty Data” Problems I Encounter and How to Save Time Fixing Them

October 1, 2024 by Jonah Hall

Common “Dirty Data” Problems I Encounter and How to Save Time Fixing Them

By M. Andrew Young

Hello, my name is M. Andrew Young. I’m a third-year Ph.D. student in the Evaluation, Statistics and Methodology program in the Educational Leadership & Policy Studies department at the University of Tennessee. For the past 4, nearly 5 years now, I have served as a higher education evaluator as a Director of Assessment. In every job I’ve had since I graduated from my undergraduate degree in 2011, I have dealt with dirty data. Now that I deal with data daily from a variety of sources and people who are content experts in their field, but not necessarily research methodologists, I encounter a lot of creative, but not useful, solutions for managing data. If you, like me, have a full plate every single day, shaving seconds and minutes off your cleaning tasks can really make your life easier.  

We are often told “there is no perfect evaluation”, “there is no perfect survey”, or even “there is no perfect data set”, but what does that look like in practical terms? Even when we are the designer of the data collection instrument(s), our data can be messy, but what happens when we are coming in way after the fact into someone’s dataset for an instrument we didn’t design, administer, or manage? In those instances, we can find ourselves having to riddle out someone else’s solution to data management. Sometimes they are good, but we weren’t given the key to know how they evaluated the data, and sometimes they are downright horrible solutions because they are designed by a human to appeal to human senses instead of being interpreted by a computation device such as a computer.  

I don’t have a ton of programming language experience, so I have had to rely on ChatGPT, for which I pay for a premium subscription, to help write code. CAVEAT: ChatGPT can be highly inaccurate, devise clunky or improper solutions based on the information you give it, and the Python and R packages are woefully out-of-date! I suggest contacting a local programming community. Use GitHub with the AI plugins and debuggers to help you! I had to learn how to debug and evaluate ChatGPT’s code, which took a long time and iterative rounds of testing to see what happened and where it failed.  

So, let’s get right down to it. I will share the most common dirty data problems I encounter, how to identify them, and what my solution is. They are in no particular order, but I have encountered them all:  

File formats that aren’t usable.  

Some data repositories that I have had to analyze data from will export a file with a .xls extension, but the actual encoding is different, like in HTML. Sounds pretty trivial, but if you must download dozens of files, this can be a time-waster.   
 
Solution: Python does some cool stuff, and if you can learn to use Pandas, openpyxl, and beautiful soup, you can get this file conversion done quickly in an entire folder. At the end of this blog post, I’ll place a share link to some extra resources including my Python script for this solution.   
  

Merged Cells, empty rows, leading/trailing spaces, carriage returns, color formatting as data, etc.  

In my workplace, and I am going to say commonly in other workplaces, Excel is the preferred place to put data. It isn’t always the best, but it is what people are used to. Sometimes people will attempt to make Excel sheets pleasing to the eye, or able to be viewed by people, but this often makes the file unreadable to Excel or other packages like R without modifications. Since I am a novice R user, and I like to be able to see my data while I’m cleaning it in a dynamic environment, I use Excel for most of my cleaning unless the dataset is too large and unwieldy to utilize Excel.  
 
Leading and trailing spaces, carriage returns, and special characters that we can’t see in a cell can make a unique identifier such as a first/last name combo or email address “look different” to Excel, meaning it doesn’t find your match unless you use “fuzzy” matching formulae, which I tend to avoid. Cleaning the data is, in my opinion, better in the long run. I have provided a VBA script that does that. I have written it so that it allows you to choose the sheet to run the script for instead of the active sheet. You can change that chunk of code if you want it to behave differently. The carriage return remover can be modified to remove other special characters or search for all of them. Here is a link to that list: https://excelx.com/characters/list/  
 
What about colors? I encountered a dataset where the person’s solution to designating different statuses for participant records was color-coding. Unfortunately, those color codes were not mutually-exclusive and some depended on each other in a hierarchical or funnel-flow manner. I always tell people “Columns are free!”, meaning, create an additional column and code those data with numbers, oh, and provide a key in your data journal so the person behind you can figure out what precisely you were doing.  

I don’t have an elegant solution for this other than formatting the range of data as a table and using the filter and sort options to filter for color. Copy, and paste your numeric code in those spaces for each filtering option.  
  

Reconciling mismatches due to form design  
 
I encounter this all the time for repeated-measures designs. Participant is asked to do a pretest in one semester/year, then a posttest in a separate semester/year. How you can identify that Participant1 at the pretest is Participant1 at the posttest is having a unique identifier. The form designer asks for email. Great! It’s free text and Participant1 put two different emails in at both times, had a typo in one of those periods, and used their full name in one time period with their shortened nickname or typed their name incorrectly in the other. Removing leading and trailing space won’t help you there.  
 
I encountered a situation where the data collectors administered a pre/posttest design in the same semester. They even used a forced-response option for the students to indicate what course they were enrolled in for the evaluation. Sounds good so far. However, I found out later that many of the courses were cross-listed, or had different names and numbers altogether depending on the enrollee’s major field of study host department. All of the cross-listed courses were options and there were no screening questions to filter for that, so Participant234 at the pretest selected one course and a different one at the posttest, even though they were the same course held at the same and time taught by the same faculty. Excel doesn’t know that. In large datasets, this can be challenging, but going back to your client and asking questions can reap a solution. My solution was to get a cross-listed course crosswalk, set a single identifier, and then use formula to replace all of the cross-listed courses (into a new column, of course) with a single descriptor.  
 
There are more scenarios, but this is common for me to encounter.  

Connecting data for participants from multiple datasets  
 
Client A shares a folder with you with 3 different forms, all with multiple tabs, and is scratching their head on how to connect datasets with participant data because the answer to their question lies in the connection of the three sources. Unfortunately for you, there was no unique identifier created to link all three, and that’s why you are there (according to them). If I knew SQL, it might not be as big an issue, but I got my start in Excel, so I’ll show you what I do in Excel to connect those sources, before OR after I’ve created a UniqueID. Sometimes I use this method to HELP create a UniqueID:  
 
Excel has VLOOKUP, HLOOKUP, and now, XLOOKUP, but a nested INDEX(MATCH()) formula is much faster than those in larger sets, so I always use it (Excel XLOOKUP vs INDEX MATCH, 2024). 
 
First, using table references is much less typing than ranges, so my first step in Excel is to ALWAYS create a table AND name it.  
 
How to use =INDEX(MATCH()) properly:  

1) For when you have a SINGLE UniqueID: Start in the table or sheet you want to pull data INTO, type =INDEX(OtherTable[ColumnName of data you want to get],MATCH([@[same row, but the column where your UniqueID lives],OtherTable[Column where the same UniqueID lives],0))  

This will bring over the data you want, matching on a SINGLE criteria using an exact match (that’s done by that “0” before the closing parentheses). 

2) For when you need to match on multiple criteria: {=INDEX(OtherTable[ColumnName of data you want to get],MATCH(1,([@[criteria col1]=OtherTable[matching criteria column]1)* ([@[criteria col2]=OtherTable[matching criteria column2])*(etc.),0,))} <– you get the {} by pressing CTRL + SHIFT + ENTER at the end of the formula to designate an array formula. It will return a whole column of #N/A’s if you don’t! Also, you need to set your table to auto-write or flash-fill formulae to save time.  

Finding duplicate entries  
Some of the most common mistakes I find in dirty data are duplicate entries the original owners didn’t know they had. This is common when data collectors don’t set their survey platform to not allow duplicate entries. The result is that you will have two different answers for the same person within days or weeks for the same form. If Participant30 took the pretest twice and the posttest once, which pretest entry do you keep?  
 
a) Look for completion first, and if there is a deep disparity, keep the more complete submission.  
b) If they are both equally-complete, negotiate with the client on what they believe is the more “valid” response. In my references is a cool study about how this is done in a manufacturing process environment. That is the article by Eckert et al. (2022). If you don’t have access to an institutional library, you may not be able to view it. 

Pairwise, listwise, or analysis-specific deletion, and why  
 
When do you use pairwise, listwise, or analysis-specific “deletion”? I will say, in the famous words of Dr. Morrow (https://faculty.utk.edu/Jennifer.Morrow) “It depends”. Each case calls for different handling, and there are several ways to go about this, but these two resources may help:  
 
https://www.ibm.com/support/pages/pairwise-vs-listwise-deletion-what-are-they-and-when-should-i-use-them  
 
TWELVE STEPS OF QUANTITATIVE DATA CLEANING: STRATEGIES FOR DEALING WITH DIRTY DATA by Morrow & Skolits (2017)  
  

Trust, but verify  
 
Last, but not least: what if, just by chance, the original data owners made a data entry error themselves?   
 
*GASP* “NEVER!” It happens, trust me.   
 
I have encountered cases where, in the same column for the same survey item the categorical data in the cells had “5 – Strongly Agree”, and “5 – Strongly Disagree”, and “1 – Strongly Disagree”. Well, which is the right entry for those participants? The client did not have a copy of the originally developed form, and we had to go back and figure out the original scale, and since there were many entries where the categorical data were overwritten with straight numerical data in the same column (probably an errant “find & replace” operation), it was even harder to determine whether 5’s were positive or negative, and if the “5 – Strongly Disagree” entries were supposed to be “5 – Strongly Agree” or “1 – Strongly Disagree”.  
 
Again, it was a negotiation with the client and a bit of data inference (using Morrow & Skolits, 2017) to help along with (Enders, 2022) to infer their responses.  

All in all, a lot of dealing with dirty data, especially when that data isn’t your own, is, in my opinion, making collaborative choices with the owners of the data, documenting those choices, and defending those choices. The phrase “garbage in, garbage out” may feel overused, but it is, nevertheless, true. While data cleaning, particularly in the light of data equity concerns, is a much larger topic than this tiny little blog post can cover. I hope this helps you along your journey of tidy data, and if you have solutions that I just am not aware of (very likely), then feel free to pass them along to myoung96@vols.utk.edu (my UTK email). I love learning time-saving techniques, and I am willing to share my dirty data secrets too! 

Additional Resources 

Link to additional resources: Dirty Data 

Eckert, C., Isaksson, O., Hane-Hagström, M., & Eckert, C. (2022). My Facts Are not Your Facts: Data Wrangling as a Socially Negotiated Process, A Case Study in a Multisite Manufacturing Company. Journal of Computing and Information Science in Engineering, 22(6), 060906. https://doi.org/10.1115/1.4055953 

Enders, C. K. (2022). Applied missing data analysis (Second Edition). The Guilford Press. 

Excel XLOOKUP vs INDEX MATCH: Which is better and faster? (2024, January 24). Ablebits.Com. https://www.ablebits.com/office-addins-blog/xlookup-vs-index-match-excel/ 

JanChaPatGud36850. (2019, August 13). Characters in Excel. Excel. https://excelx.com/characters/list/ 

Jennifer Ann Morrow Profile | University of Tennessee Knoxville. (n.d.). Retrieved September 9, 2024, from https://faculty.utk.edu/Jennifer.Morrow 

Morrow, J. A., & Skolits, G. (2017). TWELVE STEPS OF QUANTITATIVE DATA CLEANING: STRATEGIES FOR DEALING WITH DIRTY DATA. AEA 2017. 

Pairwise vs. Listwise deletion: What are they and when should I use them? (2020, April 16). [CT741]. https://www.ibm.com/support/pages/pairwise-vs-listwise-deletion-what-are-they-and-when-should-i-use-them 

Filed Under: Evaluation Methodology Blog

Cuevas (Adjunct Faculty Member) Named a NASPA Pillar of the Profession

Cuevas (Adjunct Faculty Member) Named a NASPA Pillar of the Profession

September 26, 2024 by Jonah Hall

Cuevas (Adjunct Faculty Member) Named a NASPA Pillar of the Profession

By Beth Hall Davis – September 19, 2024

Courtesy of the University of Tennessee, Knoxville – Student Life

Frank Cuevas, vice chancellor for Student Life at UT, has been named as one of NASPA’s 2025 Pillars of the Profession. This award, one of the NASPA Foundation’s highest honors, recognizes exceptional members of the student affairs and higher education community for their work and contributions to the field.  

NASPA’s award honors individuals who have created a lasting impact at their institution, leaving a legacy of extraordinary service and have demonstrated sustained, lifetime professional distinction in the field of student affairs and/or higher education.

Cuevas has been with the university since 2010 and has held several different roles in that time. As vice chancellor, Cuevas and his leadership team are responsible for student care and support, health and wellness initiatives, and leadership and engagement opportunities. He oversees more than 450 staff members and 3.7 million square feet of facility space that includes the Student Union and on-campus housing.

The new class of pillars will be officially presented and honored during the 2025 NASPA annual conference in New Orleans.

Filed Under: News

The Parasocial Relationships in Social Media Survey: What is it and why did I create it?

The Parasocial Relationships in Social Media Survey: What is it and why did I create it?

September 15, 2024 by Jonah Hall

The Parasocial Relationships in Social Media Survey: What is it and why did I create it?

Author: Austin Boyd, Ph.D.

I love watching YouTube. When I began college, I gave up on cable and during my free time I started watching YouTube instead. There was just something about watching streamers and influencers that was more compelling and comforting for me. I spent a lot of time wondering why I enjoyed it more, and it wasn’t until graduate school that I learned the answer: Parasocial Relationships. 

Parasocial Rela​​tionships and Their Measures 

Coined by Horton and Wohl (1956), parasocial ​relationships are a ​type of relationship that is experienced between a spectator and a performer’s persona. Due to the nature of the interaction, these relationships are one-sided and cannot be reciprocated ​​by the performer with which they are made. At the time, television was the most effective medium through which parasocial relationships could be developed (Horton & Strauss, 1957; Horton & Wohl, 1956). However, as time and technology have progressed, the mediums for parasocial relationships to occur have expanded beyond television to include radio, literature, sports, politics, and social media, such as Facebook, Twitter, and, of course, YouTube.  

Over the past 65+ years, hundreds of articles have been published with different scales created to measure parasocial phenomena in a variety of different contexts. W​​hile many different scales exist, they are not interchangeable across contexts,​​ and none have been validated to measure parasocial relationships in a social media context. Many of the scales were developed for specific media contexts, and because of this, they do not lend well to assessing parasocial phenomena in other situations and other forms of media without modification.​ ​Using a measure that has not been validated, and is unsuitable for a population, may compromise the results, even if it was found to be valid in a different context (Stewart et al., 2012). Furthermore, research (e.g., Dibble et al., 2016; Schramm & Hartmann, 2008) has started to question the validity of these instruments. An assertion made by Dibble et al. (2016) states that most parasocial interaction scales have not undergone adequate tests of validation. 

The Parasocial Relationships in Social Media (PRISIM) Survey 

For my dissertation, I developed and began validating the scores of the Parasocial Relationships in Social Media (PRISM) Survey to measure the parasocial relationships that people develop with influences and other online celebrities through social media (Boyd et al., 2022; Boyd et al. 2024). The survey contains 22 items that were based on three well​​ established parasocial surveys: The Audience-Persona Interaction Scale (Auter & Palmgreen, 2000), Parasocial Interaction Scale (Rubin et al., 1985), and Celebrity-Persona Parasocial Interaction Scale (Bocarnea & Brown, 2007). ​​Participants are asked to indicate their level of agreement with each of the items using a five-point Likert scale.  

The 22 items comprise four constructs: Interest In, Knowledge Of, Identification With, and Interaction With. The first factor, ​Interest In​, contains seven items covering the level of concern for, perceived attractiveness of, and devotion to the celebrity and the content that they create. The second factor, ​Knowledge Of​, contains five items that deal specifically with the participants’ knowledge of the celebrity and desire to learn more about them. While similar to the Interest In construct, the items in this construct address the ​​participants’ curiosity and fascination with the celebrity, rather than their attachment to them. The third factor, ​Identification With​, includes six items addressing the perceived similarities, such as sharing qualities and opinions, between the celebrity and the participant. Finally, the fourth factor, ​Interaction With​, is four items which covers the social aspects involved with viewing the celebrity including the participants’ feelings of social and friendship connections with them. 

After creating the survey, we conducted a psychometric evaluation of the scale. This includes assessing the content, face, construct, convergent, and discriminant validity, as well as the internal consistency reliability and measurement invariance across different social media platforms. For full explanations of the methods and results used to validate the survey see Boyd et al. (2022) and Boyd et al. (2023). We have also created FAQ for those interested in using the survey, which can be found at https://austintboyd.github.io/prismsurvey/. Both articles and the PRISM survey have been published in open access journals to allow easy access for any researcher interested in conducting parasocial relationship research in the social media landscape. 

References 

Boyd, A. T., Morrow, J. A., & Rocconi, L. M. (2022). Development and Validation of the Parasocial Relationship in Social Media Survey. The Journal of Social Media in Society, 11(2), 192-208. 

Boyd, A. T., Rocconi, L. M., & Morrow, J. A. (2024). Construct Validation and Measurement Invariance of the Parasocial Relationships in Social Media Survey. PLoS ONE, 19(3). 

Dibble, J. L., Hartmann, T., & Rosaen, S. F. (2016). Parasocial interaction and parasocial relationship: Conceptual clarification and a critical assessment of measures. Human Communication Research, 42(1), 21–44. https://doi.org/10.1111/hcre.12063  

Horton, D., & Strauss, A. (1957). Interaction in Audience-Participation Shows. American Journal of Sociology, 62(6), 579–587. doi: 10.1086/222106 

Horton, D., & Wohl, R. R. (1956). Mass Communication and Para-Social Interaction. Psychiatry, 19(3), 215–229. doi: 10.1080/00332747.1956.11023049 

Schramm, H., & Hartmann, T. (2008). The psi-process scales. A new measure to assess the intensity and breadth of parasocial processes. Communications, 33(4). https://doi.org/10.1515/comm.2008.025  

Stewart, A. L., Thrasher, A. D., Goldberg, J., & Shea, J. A. (2012). A framework for understanding modifications to measures for diverse populations. Journal of Aging and Health, 24(6), 992–1017. https://doi.org/10.1177/0898264312440321  

Filed Under: Evaluation Methodology Blog

mlmhelper: An R helper package for estimating multilevel models

mlmhelper: An R helper package for estimating multilevel models

September 1, 2024 by Jonah Hall

mlmhelper: An R helper package for estimating multilevel models

Author: Louis Rocconi, Ph.D.

In this blog post, I want to introduce you to the R package mlmhelpr, which my colleague and ESM alumni, Dr. Anthony Schmidt, and I created. mlmhelpr is a collection of helper functions designed to streamline the process of running multilevel or linear mixed models in R. The package assists users with common tasks such as computing the intraclass correlation and design effect, centering variables, and estimating the proportion of variance explained at each level.  

Multilevel modeling, also known as linear mixed modeling or hierarchical linear modeling, is a statistical technique used to analyze nested data (e.g., students in schools) or longitudinal data. Both nested and longitudinal data often result in correlated observations, violating the assumption of independent observations. This issue is common in educational, social, health, and behavioral research. Multilevel modeling addresses this by modeling and accounting for the variability at each level, leading to more accurate estimates and inferences. 

The inspiration for developing mlmhelpr came from my experience teaching a multilevel modeling course. Throughout the semester, I found myself repeatedly writing custom functions to help students perform various tasks mentioned in our readings. Additionally, students often expressed frustration that lme4, the primary R package for estimating multilevel models, did not provide all the necessary information required by our textbooks and readings. After the semester ended, Anthony and I discussed the need to consolidate these functions into a single R package, making them accessible to everyone. mlmhelpr offers tests and statistics from many popular multilevel modeling textbooks such as Raudenbush and Bryk (2002), Hox et al. (2018), and Snijders and Bosker (2012), and like every other R package, it is free to use! 

The following is a list of package functions and descriptions.  

boot_se 

This function computes bootstrap standard errors and confidence intervals for fixed effects. This function is mainly a wrapper for lme4::bootMer function with the addition of confidence intervals and z-tests for fixed effects. This function can be useful in instances where robust_se does not work, such as with nonlinear models (e.g., glmer models). 

center 

This function refits a model using grand-mean centering, group-mean/within cluster centering (if a grouping variable is specified), or centering at a user-specified value. For additional information on centering variables in multilevel models, see Enders and Tofighi (2007). 

design_effect 

This function calculates the design effect, which quantifies the degree to which a sample deviates from a simple random sample. In the multilevel modeling context, this can be used to determine whether clustering will bias standard errors and whether the assumption of independence is held. 

hausman 

This function performs a Hausman test to test for differences between random- and fixed-effects models. This test determines whether there are significant differences between fixed-effect and random-effect models with similar specifications. If the test statistic is not statistically significant, a random effects model (i.e. a multilevel model) may be more suitable (i.e., efficient). The Hausman test is based on Fox (2016, p. 732, footnote 46). I consider this function experimental and would interpret the results with caution. 

icc 

This function calculates the intraclass correlation. The ICC represents the proportion of group-level variance to total variance. The ICC can be calculated for two or more levels in random-intercept models. For models with random slopes, it is advised to interpret results with caution. According to Kreft and De Leeuw (1998, p. 63), “The concept of intra-class correlation is based on a model with a random intercept only. No unique intra-class correlation can be calculated when a random slope is present in the model.” However, Snijders and Bosker (2012) offer a calculation to derive this value (equation 7.9), and their approach is implemented. For logistic models, the estimation method follows Hox et al. (2018, p. 107). For a discussion of different methods for estimating the intraclass correlation for binary responses, see Wu et al. (2012). 

ncv_tests 

This function computes three different non-constant variance tests: (1) the H test as discussed in Raudenbush and Bryk (2002, pp. 263-265) and Snijders and Bosker (2012, p. 159-160), (2) an approximate Levene’s test discussed by Hox et al. (2018, p. 238), and (3) a variation of the Breusch-Pagan test. The H test computes a standardized measure of dispersion for each level-2 group and detects heteroscedasticity in the form of between-group differences in the level-one residual variances. Levene’s test computes a one-way analysis of variance of the level-2 grouping variable on the squared residuals of the model. This test examines whether the variance of the residuals is the same in all groups. The Breusch-Pagan test regresses the squared residuals on the fitted model. A likelihood ratio test is used to compare this model with a null model that regresses the squared residuals on an empty model with the same random effects. This test examines whether the variance of the residuals depends on the predictor variables. 

plausible_values 

This function computes the plausible value range for random effects. The plausible values range is useful for gauging the magnitude of variation around fixed effects. For more information, see Raudenbush and Bryk (2002, p. 71) and Hoffman (2015, p. 166). 

r2_cor 

This function calculates the squared correlation between the observed and predicted values. This pseudo R-squared is similar to the R-squared used in OLS regression. It indicates the amount of variation in the outcome that is explained by the model (Peugh, 2010; Singer & Willett, 2003, p. 36). For additional pseudo-R2 measures, see the r2glmm and performance packages. 

r2_pve 

This function computes the proportion of variance explained for each random effect level in the model (i.e., level-1, level-2) as discussed by Raudenbush & Bryk (2002, p. 79). For additional pseudo-R2 measures, see the r2glmm and performance packages. 

reliability 

This function computes reliability coefficients for random effects according to Raudenbush and Bryk (2002) and Snijders and Bosker (2012). The reliability coefficient indicates how much of the variance in the random effect is due to true differences between clusters rather than random noise. The empirical Bayes estimator for the random effect combines the cluster mean and the grand mean, with the weight determined by the reliability coefficient. A reliability close to 1 puts more weight on the cluster mean while a reliability close to 0 puts more weight on the grand mean. 

robust_se 

This function computes robust standard errors for linear models. It is a wrapper function for the cluster-robust standard errors from the clubSandwich package that includes confidence intervals. See the clubSandwich package for additional information and mlmhelpr::boot_se for an alternative. 

taucov 

This function calculates the covariance between random intercepts and slopes. It is used to quickly get the covariance and correlation between intercepts and slopes. By default, lme4 only displays the correlation. 

As of August 26, 2024, the package has been downloaded 5,062 times! If you use R to estimate multilevel models, give mlmhelpr a try, and let me know if you find any errors or mistakes. I hope you find it helpful. If you are interested in creating your own R package, check out the excellent R Package development book by Wickham and Bryan: https://r-pkgs.org/.  

Happy modeling!  

Resources and References 

Enders, C. K., & Tofighi, D. (2007). Centering predictor variables in cross-sectional multilevel models: A new look at an old issue. Psychological Methods, 12(2), 121-138.  

Fox, J. (2016). Applied regression analysis and generalized linear models (3rd ed.). SAGE Publications. 

Hoffman, L. (2015). Longitudinal analysis: Modeling within-person fluctuation and change. Routledge. 

Hox, J. J., Moerbeek, M., & van de Schoot, R. (2018). Multilevel analysis: Techniques and applications (3rd ed.). Routledge. 

Kreft, I. G. G., & De Leeuw, J. (1998). Introducing multilevel modeling. SAGE Publications. 

Peugh, J. L. (2010). A practical guide to multilevel modeling. Journal of School Psychology, 48(1), 85-112.  

Raudenbush, S. W., & Bryk, A. S. (2002). Hierarchical linear models: Applications and data analysis methods (2nd ed.). SAGE Publications. 

Singer, J. D., & Willett, J. B. (2003). Applied longitudinal data analysis: Modeling change and event occurrence. Oxford University Press. 

Snijders, T. A. B., & Bosker, R. J. (2012). Multilevel analysis: An introduction to basic and advanced multilevel modeling (2nd ed.). SAGE Publications. 

Wu, S., Crespi, C. M., & Wong, W. K. (2012). Comparison of methods for estimating the intraclass correlation coefficient for binary responses in cancer prevention cluster randomized trials. Contemporary Clinical Trials, 33(5), 869. 

Filed Under: Evaluation Methodology Blog

Organizing your Evaluation Data: The Importance of Having a Comprehensive Data Codebook

Organizing your Evaluation Data: The Importance of Having a Comprehensive Data Codebook

August 16, 2024 by Jonah Hall

Organizing your Evaluation Data: The Importance of Having a Comprehensive Data Codebook

By J.A. Morrow

Data Cleaning Step 1: Create a Data Codebook 

As some of you, know I love data cleaning. Weird I know, but I have always found it relaxing to make sure that I have all my data (or my client’s data) organized and cleaned before I start addressing the evaluation questions for a project. Many years ago, myself and my colleague, Dr. Gary Skolits, developed a 12-step method for data cleaning. Over the years we have tweaked the steps and brought on another colleague, Dr. Louis Rocconi, to refine and enhance our workshop training on this topic. One thing though that has remained consistent…and is what I believe to be the most important step…Create a Data Codebook! 

Why a Data Codebook? 

One of my pet peeves is a disorganized project and inconsistency in how data are organized. For every project, whether it is an evaluation research or assessment project, I start developing a data codebook before I even begin data collection. When I take on a new project from an evaluation or assessment client, I first ask for their codebook or if they don’t have one then I create it for them. Why is this so important, you ask? Think of your codebook as your organizational tool and project history all rolled into one document. It contains everything about your project and greatly aids in getting everyone on your team organized and on the same page. Your clients (and your future self) will greatly appreciate this too!  

Your data codebook is a living document, it changes throughout the life of a project as you add new data, modify data, and make decisions throughout the course of the project. Not having a data codebook can lead to confusion and increase the chances of someone on your team making a mistake when analyzing data and disseminating information to your clients. Sadly, I have sat through presentations where a client points out a mistake or has a question about the data that can’t be answered by the evaluation team because they don’t have a record of what was done. Clients are never happy when this happens! 

What is in a Data Codebook? 

I usually include the following 9 things in my data codebooks: 

  1. Name of the Evaluation Project 
  1. Variable Names 
  1. Variable Labels 
  1. Value Labels 
  1. Newly Created/Modified Variables (and how you created/modified these) 
  1. Citations for Scales and Sources of Data for the Project 
  1. Reliability of any Composite Items 
  1. List of Datasets and Sample Size for Each 
  1. Project Diary/Notebook 

I typically put the first 7 in one table, which I create in Microsoft Word. You can also create your codebook using Excel or any other analysis software package (e.g, SPSS, R). This first table provides details about all of the data for a project. As I make any changes to the datasets, I add any new variables that I create to this table and write up my decision making for any changes in the project diary/notebook section of my codebook. 

For the list of datasets and sample sizes I usually have that as a separate table at the end of my codebook. As I create a new dataset or project file I enter that information in this section of the codebook. I also include a brief description of what is contained in the new data file. I always organize this table by the most recent files first. 

Lastly, I include an extensive project diary/notebook at part of my codebook. For some projects these can be very long and have many team members adding to it so I typically will have this as a document link in the codebook. The document link takes team members to an external Google document where we all can write and edit information about what we are working on for the project and what decisions were made. I cannot overstate how important it is to have a detailed project diary/notebook for an evaluation project. It is especially useful as you are writing your reports for your client about what you did and why you did something in a particular way. Anytime I have a project meeting with my team or a meeting with my client I take notes in our project notebook. 

Additional Advice 

So, I hope I have provided some useful tips as you start the process of organizing your evaluation data. One last piece of advice….share this codebook with your client! At the end of a project, I give the codebook (minus the project notebook as that is internal to my team) and final datasets (sanitized at some level depending on the contract) to my client so they can continue to utilize the data for their program/organization. Empower your evaluation clients to better understand their data and how their data was processed! 

Resources 

12 Steps of Data Cleaning Handout:
https://www.dropbox.com/scl/fi/x2bf2t0q134p0cx4kvej0/TWELVE-STEPS-OF-DATA-CLEANING-BRIEF-HANDOUT-MORROW-2017.pdf?rlkey=lfrllz3zya83qzeny6ubwzvjj&dl=0 

https://datamgmtinedresearch.com/document

https://dss.princeton.edu/online_help/analysis/codebook.htm

https://ies.ed.gov/ncee/rel/regions/central/pdf/CE5.3.2-Guidelines-for-a-Codebook.pdf

https://libguides.library.kent.edu/SPSS/Codebooks

https://web.pdx.edu/~cgrd/codebk.htm

https://www.datafiles.samhsa.gov/get-help/codebooks/what-codebook

https://www.icpsr.umich.edu/web/ICPSR/cms/1983

https://www.medicine.mcgill.ca/epidemiology/joseph/pbelisle/CodebookCookbook/CodebookCookbook.pdf

https://www.slideshare.net/sl

Filed Under: Evaluation Methodology Blog

The Conventional and Unconventional Places I’ve Found Research Ideas

The Conventional and Unconventional Places I’ve Found Research Ideas

August 1, 2024 by Jonah Hall

The Conventional and Unconventional Places I’ve Found Research Ideas

By Dr. Austin Boyd

Research is the backbone of the academic world. It provides us with a ​​​​better understanding of the world around us and allows knowledge to be passed on and built upon by future generations of researchers. Research may be conducted as​ a​ class project, larger end of course capstone or dissertation requirement, or as ​a ​regular part of many careers in and outside of academia. But where does one come up with a research idea? For some, finding inspiration for research projects is easy, resulting in a laundry list of ideas to pick and choose from. For others, coming up with even a single research idea might take longer than the research itself. Compound this with the fact that some fields have existed for decades, or even centuries, and it might feel as though there is nothing left to research. However, as daunting as it may seem, there are always more questions to be asked, you just need to ​​keep an open mind.

My name is Austin Boyd, and I am a data analyst​​, instructor, and ESM alumni. When I began conducting research nearly a decade ago, I struggled to come up with research ideas. In fact, when I entered my graduate doctoral program, I had no prospective research ​​ideas, and it took me almost three years to finally come up with a dissertation topic. However, since then, I have been a part of dozens of research projects that have led to conference posters, presentations, white papers, and peer-reviewed publications, and I can say with confidence that research ideas can come from anywhere. To prove this, I am going to go over my first three publications to show that inspiration is everywhere, and then provide some suggestions of places to look for your own research ideas.

Project 1: A Student with a Question

My first research idea came about as conventionally as ​they​ come. I was a student with a question, and with the guidance of a professor, we came up with a research idea and then pursued it. Once upon a time, I took a statistics course on Item Response Theory (IRT). While sitting in class one day, we were discussing the underlying assumptions of IRT presented in Embretson and Reise’s Psychometric Methods: Item response theory for psychologists (2000). After class, I ​approached​ my professor with a question: “How does skewness impact measurement invariance?” Little did I know, this was a question she had always wondered herself, but never had the time to pursue. Over the next few weeks in office hours, we discussed ideas on how to address this question, and before long, she told me that she could provide me with data if I would be interested in exploring the topic further. Over the course of the next three years, she and I worked to test the robustness of this assumption, ​and​ ended up presenting our findings at two conferences and published them in the Journal of Applied Measurement (Boyd et al., ​​2020).  

Project 2: Friends Talking About Movies

My second research idea was much less conventional. Early one morning while playing video games and talking about the latest Marvel movie with a friend, I started wondering just how entwined the Marvel Cinematic Universe was. I had previously worked on a project where I used Social Network Analysis (SNA) to look at the connectedness of schools within a public school district and thought maybe I could use the same technique here. After scouring IMDb for the character list for the 23 marvel movies that had been released at that time, I used SNA to create a sociogram to show how all the movies were connected through the character appearances (see below). I realized that if I could demonstrate how easy it was to do this with something as random as Marvel movies, then maybe other researchers would be able to see how easy it is to use in their research. With the help of my research advisor, we published a paper in Practical Assessment, Research, and Evaluation to serve as a guide for others on formatting their data so that they could also use SNA in their research (Boyd & Rocconi, 2021). 

Project 3: Watching YouTube to Avoid Schoolwork

My third research idea was born out of avoiding schoolwork. In one of my graduate courses, we had to develop and design an original survey on a topic of our choosing. There were many steps to this project, ​the first of which was ​​imply to propose an idea for the survey. Instead of doing that, I was watching people play video games on YouTube. After a while, I started wondering what makes online celebrities and influencers so popular, and after a quick Google search, I learned about a concept called parasocial relationships. These are the one-sided relationship​s​ that a viewer makes with a performer (Horton & Wohl, 1956). I kept digging into the topic and learned that people have been researching parasocial relationships and interactions for over 60 years, long before YouTube, or even the internet, existed. ​S​everal surveys had already been developed for ​understanding​​     ​ parasocial relationships and interactions with television personalities, TV characters, fictional characters, and even political candidates, but none for social media based celebrities and influencers. I decided that this would be the topic of my survey. Over the course of the semester, I developed my survey and put together a proposal for how I would pilot and assess the reliability and validity of the survey. I could have walked away from it once the course was over, but I came back a year later once I realized that this survey could actually be the basis for a real research project. As a result, my one class project became the basis for my entire dissertation and yielded two publications on the development and validity of the Parasocial Relationship in Social Media (PRISM) Survey (Boyd et al., 2022; Boyd et al. 2023).​ 

Research ideas are everywhere, even when it seems like there is nothing left to explore. And when it feels this way there are ​​five places I suggest taking a look:  

  1. Prior literature – Prior literature if full of research ideas. Many publications include a section on future research ideas in the discussion, some of which are never fully explored. This can be a great place to start with a new research interest. 
  1. Old class projects – Returning to an idea after being away from it can provide a new outlook that sparks a research idea. Coming back to an old project with the new knowledge gained from working on others can be revitalizing. 
  1. Other researchers – Whether they be professors or peers, other researchers can be a great sounding board for ideas. Their knowledge and experiences can provide different points of view that can help inspire new project ideas. Some might even share ideas that they don’t have the time or interest in pursuing. 
  1. Personal hobbies and interests – It might seem weird, but even personal interests can lead to research ideas. Without my interest in Marvel movies and YouTube, neither of my projects would have existed. 
  1. ​​​Friends and family – Even if they don’t understand your research, sometimes talking to friends and family about it can spark new ideas. Their lack of knowledge on the subject can bring up questions that you never even thought about.​     ​ 

References:

​​​Boyd, A. T., Rocconi, L. M., & Morrow, J. A. (2024). Construct validation and measurement invariance of the Parasocial Relationships in Social Media Survey. PLoS ONE. 

Boyd, A. T., Morrow, J. A., & Rocconi, L. M. (2022). Development and validation of the Parasocial Relationship in Social Media Survey. The Journal of Social Media in Society, 11(2), 192-208. Available online: https://www.thejsms.org/index.php/JSMS/article/view/1085 

Boyd, A. T., & Rocconi, L. M. (2021). Formatting data for one and two mode undirected social network analysis. Practical Assessment, Research & Evaluation, 26(24). Available online: https://scholarworks.umass.edu/pare/vol26/iss1/24/ 

Boyd, A. T., Schmidt, K. M., & Bergeman, C. S. (2020). You know what they say about when you assume: Testing the robustness of invariant comparisons. Journal of Applied Measurement, 21(2), 190-209. 

Embretson, S. E., & Reise, S. (2000). Psychometric methods: Item response theory for psychologists. Mahwah, NJ: Lawrence Erlbaum. 

Horton, D., & Wohl, R. R. (1956). Mass communication and parasocial interaction. Psychiatry, 19(3), 215–229. doi: 10.1080/00332747.1956.11023049 

Filed Under: Evaluation Methodology Blog

ESM: Building Blocks for a Data Science Career

ESM: Building Blocks for a Data Science Career

July 15, 2024 by Jonah Hall

ESM: Building Blocks for a Data Science Career

By Anthony Schmidt

When I began the ESM program in 2018, I was unsure of the career path I would follow. I knew I wanted to do “research” on something related to education, but I was unsure of what that was. As I went through the program, I naturally began to focus more and more on quantitative skills (e.g., statistics, psychometrics, programming). Little did I know at the time, but these skills, as well as the general research, qualitative, and “soft” skills I was gaining, prepared me to be an excellent candidate as an educational data scientist within the EdTech industry. 

I have been a data scientist at Amplify, an EdTech company that publishes curriculum products and offers an online teaching and learning platform, for nearly three years. The term data science, while a ubiquitous term and job title, is unfortunately a vague concept. It can mean a variety of different things, from basic descriptive data analyses to complex machine learning development operations. It spans an entire continuum that represents data from end-to-end – from its generation in various applications, assessments, or surveys all the way to its consumption in statistical reports, business intelligence dashboards (made in applications like Tableau or PowerBI), or fraud alerts. 

In my time as a data scientist, I have performed many roles along this continuum. On any given day, I may be in meetings that involve new product features and the data that will be generated from them, and how best to extract that data and create useful data warehouse tables. I may be advising other teams on how best to use our data to build teacher-facing reports on student learning. I may be building a model in SQL that will deliver data to a dashboard used by customer account representatives who need to understand a district’s usage of a particular product. Or I may be using R to analyze millions of rows of performance data to understand patterns of learning through complex multilevel models or psychometrics. As a data scientist, my role is to be an expert in the data at any point in its lifecycle. If this sounds exciting – it is!  

From ESM to DS 

The ESM program helped me move into a career in data science by building three broad areas of competency: technical skills, domain knowledge, and power skills. 

In terms of technical skills, becoming proficient in R was a key competency that helped me land a job in EdTech. R is the language of statistics and one of the key languages of data science (alongside Python and SQL). During my time in the ESM program, I became what I would describe as an advanced user of R. I not only knew how to run individual statistical analyses but built up skills in functional programming (e.g., writing functions to implement DRY [don’t repeat yourself] principles), literate programming (e.g., using R Markdown to build automatic reports, my CV, and even my dissertation [Github link; TRACE link]!), software development principles (such as use of git), and even package development. 

Before my ESM courses, I was not a programmer in any sense. I dabbled in some HTML and CSS as a teenager, but mostly through WYSIWYG-based (“what you see is what you get”) development environments. I can point to Statistics in Applied Fields III as the course where I began taking programming more seriously. In particular, Multilevel Modeling and Advanced Measurement (all of which were R-based) were where I really leveled up my skills, and then various internships and projects (including my portfolio and dissertation) forced me to upskill even more. One area I particularly enjoyed was building advanced data visualizations using the ggplot2 package. This led to various research opportunities, a pretty cool poster presentation related to data viz on Twitter, and even a career as a data visualization designer prior to becoming a data scientist. 

Becoming an advanced user of R built up a mental schema that made any data-based project easy to tackle, as I had a large technical toolset from which to draw. It also made learning new R-based frameworks easy, such as Tidymodels for machine learning or Plumber for API deployment. Furthermore, it provided a foundation for learning additional computer languages, including SQL and Python. 

While programming skills like these are important in data science, it is not enough. You also need to possess what I am broadly referring to as domain knowledge.  This category encompasses the quantitative domain, the research domain, and the education domain. 

What often sets a data scientist apart from a data analyst is the quantitative methodological skills that the data scientist brings to the table. We are tasked with not only describing data but inferring complex relationships from it. Having domain knowledge in quantitative methods is a key competency for data science. We are often asked to use various methods to examine relationships, make inferences, and sometimes establish causal relationships (often in the form of A/B tests). Having a solid foundation in regression techniques (e.g., OLS, logistic, multilevel) facilitates this. Furthermore, this foundation also makes learning new techniques to help answer questions or solve problems much easier. For instance, I did not take any courses on generalized linear models (beyond logistic regression), machine learning, or sentiment analysis, but I have had to use all of the methods. Learning to do so was easier because of the foundational quantitative skills I learned in my ESM course, especially the multilevel modeling course.

A related but separate domain is “research” – being able to design a research project (whether that is observational, survey, experimental etc.) and understand when to employ quantitative vs qualitative techniques is also a much sought after skill. I am in many meetings where I have to think through the best way to collect data in order to answer questions (i.e., do research). Sometimes, this also involves suggesting qualitative ideas to our user experience researchers or working with them on mixed methods approaches. So, while having a quantitative background is extremely useful, having general research methods skills helps to place quantitative research within a more purposeful context that solves business problems or answers strategic business questions. 

While not applicable to all data science roles, having a background in education also certainly helps in the world of EdTech. I came to the ESM program with a background in language instruction (TESOL) and about 10 years of teaching experience. That helped establish a mental context in which I could apply real or hypothetical research projects. Many of our courses, readings, and assignments were also contextualized within education, whether that was K-12, higher education, or adult education. All of these experiences translate into helping ground my understanding of my company’s data into a familiar context, one in which I can explain teacher and student actions in terms of pedagogy, theory, and practical experience. Even if you have no prior experience in education, the ESM program offers numerous opportunities to learn about and research a variety of educational contexts. 

Throughout the ESM program, we are steeped in an environment where we need to employ power skills, also often referred to as “soft” skills. I often work on cross-functional teams that comprise myself and people from engineering, product managers, or content authors. These are what we might consider non-technical stakeholders in various projects. Being able to pitch ideas, understand requirements, or translate complex analyses into audience-friendly terminology is essential. These tasks directly reflect the group work and presentations we often had to complete in ESM courses, as well as the series of required program evaluation courses. While I am not an evaluator and I don’t work in an evaluation setting, the skills I learned in these courses, particularly Program Evaluation III, are essential for working with various stakeholders in these cross-functional groups.  

Finally, one skill we often take for granted is being a “fast learner”. It is an absolute requirement in any job setting, and no less true for working in data science. Being a graduate student is nothing if not an exercise in 4+ years of being a fast learner. It is something that should be emphasized in any interview. You are never going to know everything, but your experience as a graduate student demonstrates that you have the ability to learn, quickly, and often in a fast-paced environment – a perfect description of EdTech. 

Advice for Aspiring Data Scientists 

To wrap up this blog post, I would like to offer some basic advice for those interested in a career in (educational) data science. First, I’d recommend completing as many quantitative courses as possible both inside and outside of the ESM program. If you don’t see something you want to learn being taught, I’d recommend working with a professor and learning those skills for credit as part of an independent study. I’d also look into the educational data science graduate certificate that UTK offers. 

I would also recommend doing a search on Google Scholar – both journal articles and dissertations – to understand the landscape of data science research within education. This can help you frame various projects, inspire your own dissertation, or identify methodological areas you would like to learn about. 

Finally, I would strongly recommend finishing your PhD program with a solid background in R and intermediate levels of proficiency in SQL. If you can add in Python, that will make you an even stronger candidate. Take advantage of LinkedIn learning (that is how I learned SQL) while you have it! 

I hope that my blog post has given you some insight into how I have translated my ESM skills into a career as an educational data scientist. Feel free to reach out to me anytime with questions related to ESM or job hunting in EdTech. You can find my latest contact info and CV information here: https://www.anthonyschmidt.co/. 

Good luck! 

Additional Resources (beyond ESM courses and your professors!) 

  • LinkedIn Learning (available through UTK) for learning R, Python, SQL, and ML 
  • SQL Exercises – I used these to prepare for several DS interviews 
  • bnomial Daily ML questions 

Filed Under: Evaluation Methodology Blog, Uncategorized

  • « Previous Page
  • 1
  • 2
  • 3
  • 4
  • 5
  • …
  • 13
  • Next Page »

Educational Leadership and Policy Studies

325 Bailey Education Complex
Knoxville, Tennessee 37996

Phone: 865-974-2214
Fax: 865.974.6146

The University of Tennessee, Knoxville
Knoxville, Tennessee 37996
865-974-1000

The flagship campus of the University of Tennessee System and partner in the Tennessee Transfer Pathway.

ADA Privacy Safety Title IX