Arts-Based Data Visualization Project Pages

These curricular materials were intended specifically for our work with eighth-grade students in STEM and media arts classroom contexts in East Tennessee. However, we encourage you to adapt them for use in other educational contexts.*
Water Quality: STEM
[Insert link to the Google Drive folder associated with the STEM curriculum]
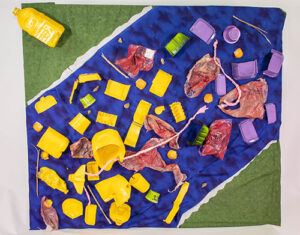
An 8th-grade student group’s sculptural installation visualizes the percentages of various microplastics in the Tennessee River.
Story: Media Arts
[Insert link to the Google Drive folder associated with the media arts curriculum]

An 8th-grade student’s data visualization shows the number of cats adopted over time.
The version developed specifically for Knox County Schools:
[Insert link to the Google Drive folder associated with the media arts curriculum]
*Feel free to use these materials as you see fit, but please give proper citation credit (citation information is in each document’s footer).